- What is Splunk
- About Splunk stats command
- Splunk-stats commands
- Stats function options
- Sparkline function options
- Memory usage with functions
- Conclusion
What is Splunk
Splunk is a very well-known platform for the big data associated with its collections as well as for analytics. The main requirement of Splunk is to extract insights from a huge amount of data. It also helps to monitor, analyze and visualize the data generated from the machine data algorithms in real-time. The user can also perform processes like indexing, capturing, and relating the machine-derived data by putting it in a container for the searching process which helps to produce alerts, graphs, visuals, and dashboards. It helps in contributing to the building of infrastructure and business related to the IT field.
Get ahead in your career by learning Splunk course through hkrtrainings Splunk Training !
About Splunk stats command
The Splunk stats command is a command that is used for calculating the summary of stats on the basis of the results derived from a search history or some events that have been retrieved from some index. This command only returns the field that is specified by the user, as an output. A user can use more than one function by invoking the stats command, however, a user can make the use of BY clause only once. A user can perform a lot of functions such as finding the average, grouping the results by a field, performing multiple aggregations, finding the range, finding mean and variance, etc. using the Splunk stats command.
Splunk-stats commands
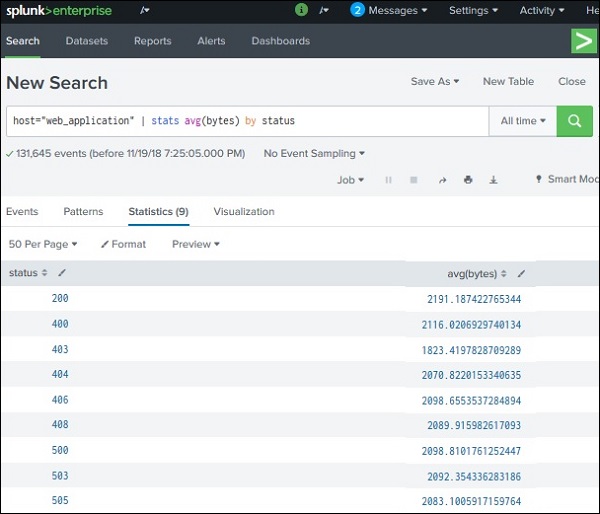
1. Finding the average: a user can use the avg() function for finding the average of a numeric field the function takes up the name of the field as the input. If the user does not use the BY clause, he gives only one record showing the average number of the field containing all the events. However, if the user uses a BY clause, he will get more than one row that will depend on the grouping of the fields along with an additional field.
Let us see the example below and try to find the average byte size of a file that is grouped by an HTTP code. The syntax is given below:
host = ”web application” | stats avg(bytes) by status

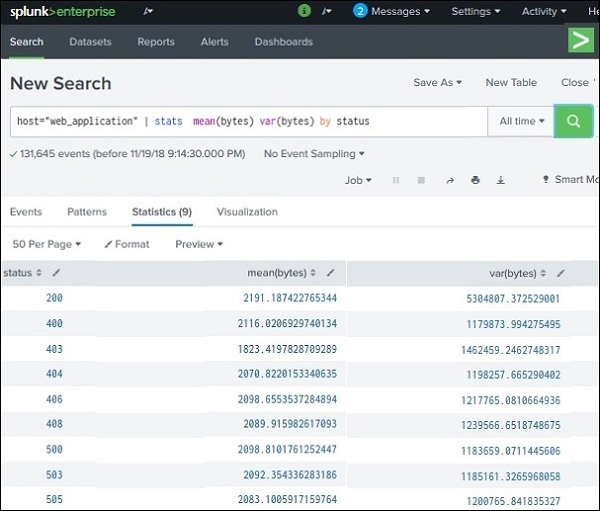
2. Finding mean and variance: We define mean as an average of all the given numbers whereas variance is the average of the difference squared from the value of the mean. Both these functions are also calculated in a much similar way to the average in the above section. However, the functions that we use are mean() and var().

The syntax is given below:
host = ”web application” | stats mean(bytes) var(bytes) by status

Splunk Administration Training
- Master Your Craft
- Lifetime LMS & Faculty Access
- 24/7 online expert support
- Real-world & Project Based Learning
The output depicts the variance and the mean of all the field values which are named bytes and all of them are organized by the HTTP events.
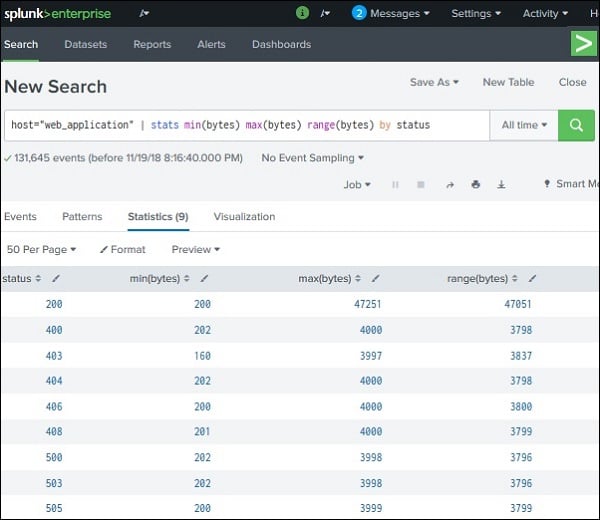
3. Finding Range: This function is used for displaying the range of values of a field which is numeric type. The function that is used to find the range of several values is range(). Along with the range function, we make use of min() and max() for calculating the maximum and minimum of the ranges. We can also calculate the range by first calculating the max() and then min() and then subtracting both so that we get the desired range. The syntax is given below:
host = ”web application” | stats min(bytes) max(bytes) range(bytes) by status
Stats function options
The stats function options help the user in calculating the aggregation statistics with the results set, like the count, average, or sum. The stats functions are very much like SQL aggregation. If the user uses the stats without the BY clause, he will only get a single row as an output. But if he uses a BY clause, then one row per different value will be returned as an output. Everything that a stats command can calculate, will be based on the statistics of the fields present in the events.
Syntax:
Basic syntax:
stats (stats_fucntion (field_anme) [AS field]).......... [BY_clause field_list]
Complete syntax:
stats [partition=] [all_numbers=] [delim=] ( .... | .... ) [ ]
Lets's get started with Splunk Tutorial online!

Subscribe to our YouTube channel to get new updates..!
Function 1: stats-agg-term
The syntax for this function is ( | ) [AS]. The function is called the function for statical aggregation. A user can apply this function to a single field, a set of fields, or an eval function as well. This function outs the field in the form of a new field with a name that can be specified by the user. He can also make use of wildcard characters as field names.
Function 2: allnum
The syntax for this function is allnum=. If the value of allnum= computes equals true, then the user can perform numerical stats on the numeric field values. This function is false by default.
Function 3: delim
The syntax for this function is delim=. It shows the delamination of the values present in the list() or values() field aggregation. This function has a default value which is a single space.
Function 4: By clause
The syntax for this function is BY. a user can make use of wildcard characters as multiple field names using the same name. The only need is for the specification of each field to be separately defined.
Function 5: partitions
The syntax for this function is partitions=. A user can use this function to partition the input data that is based on split type multithreaded reduce. This function has a default value which is1.
Function 6: sparkline-agg-term
The syntax for this function is [AS]. This function is called the sparkline aggregation function. The [AS] clause is used for placing the outcome in a new field with any name that the user wishes. He can also make use of wildcard characters as field names.
Other stats functions: avg(), model(), count(), min(0, exactperc(), median(), first(), latest(), last(), c(), dc(), values(), upperperc(), varp(), var(), etc.
Sparkline function options
These functions help in working on majorly 3 fields which are win-loss, columns as well as line. They are used for the visualization of continuous data. For example, if a user wants to compare two types of data in a scenario, etc. They are only visible as table cells and mainly display the outcomes which are related to time-based scenarios. There exists a primary key for every row in a sparkline function.
Function 1: sparkline-agg
The syntax for this function is sparkline count() and sparkline ((),). In this function, there exists a sparkline specific that helps to specify the field’s aggregation function. If the user does not specify any timespan, then it picks the timespan of his own mostly based on the search time. A user can also make use of wildcard characters as field names.
Function 2: sparkline-func
The syntax for this function is sparkline count(), c(), dc(), avg(), stdev(), sum(), varp(), var(), min(0, sumsq(), range(), max().
These functions help the user in generating the sparkline values. The sparkline values are formed by applying the function to all the events present in the aggregation scenario.
Memory usage with functions
There can be a lot of functions that are expensive from the memory point of view as compared to the other functions. For an instance, a function such as distinct_count needs a lot more memory as compared to the count() function. The function contains a lot of values as well as list functions which also tend to require a huge amount of memory.
Top 70 frequently asked Splunk interview questions & answers for freshers & experienced professionals
Conclusion
In this article, we have discussed Splunk stats commands in detail. Splunk is a very well-known platform for the big data associated with its collections as well as for analytics. The main requirement of Splunk is to extract insights from a huge amount of data. We have also discussed a few commands for performing methods such as finding the average of the numbers, finding the range, etc. Then we talked about various Spunk and sparkline function options such as C90, count(), stdev(), avg(), etc., along with their uses.
Related Articles:
About Author
As a senior Technical Content Writer for HKR Trainings, Gayathri has a good comprehension of the present technical innovations, which incorporates perspectives like Business Intelligence and Analytics. She conveys advanced technical ideas precisely and vividly, as conceivable to the target group, guaranteeing that the content is available to clients. She writes qualitative content in the field of Data Warehousing & ETL, Big Data Analytics, and ERP Tools. Connect me on LinkedIn.
Upcoming Splunk Administration Training Online classes
| Batch starts on 19th Feb 2026 |
|
||
| Batch starts on 23rd Feb 2026 |
|
||
| Batch starts on 27th Feb 2026 |
|
FAQ's
The main difference between stats and charts in Splunk is the specification of a number of fields using the BY clause.
The TOP commands help in finding the major common values present in the fields.
The main requirement of Splunk is to extract insights from a huge amount of data. It also helps to monitor, analyze and visualize the data generated from the machine data algorithms in real-time.
Index: An Index in Splunk is the repository of the data in Splunk. It basically contains all the data that a user can make use of in Splunk.
Source type: A source type is a default field that is specified to all the incoming data present in Splunk. Hence, it can be used perfectly for indexing.


