SIEM ELK Stack
Last updated on Jan 25, 2024
What is the ELK Stack?
Elasticsearch, Logstash, and Kibana were the three open-source products developed, managed, and maintained by Elastic until around a year ago. The inclusion of Beats made the stack a four-legged effort, prompting the Elastic Stack to be renamed.
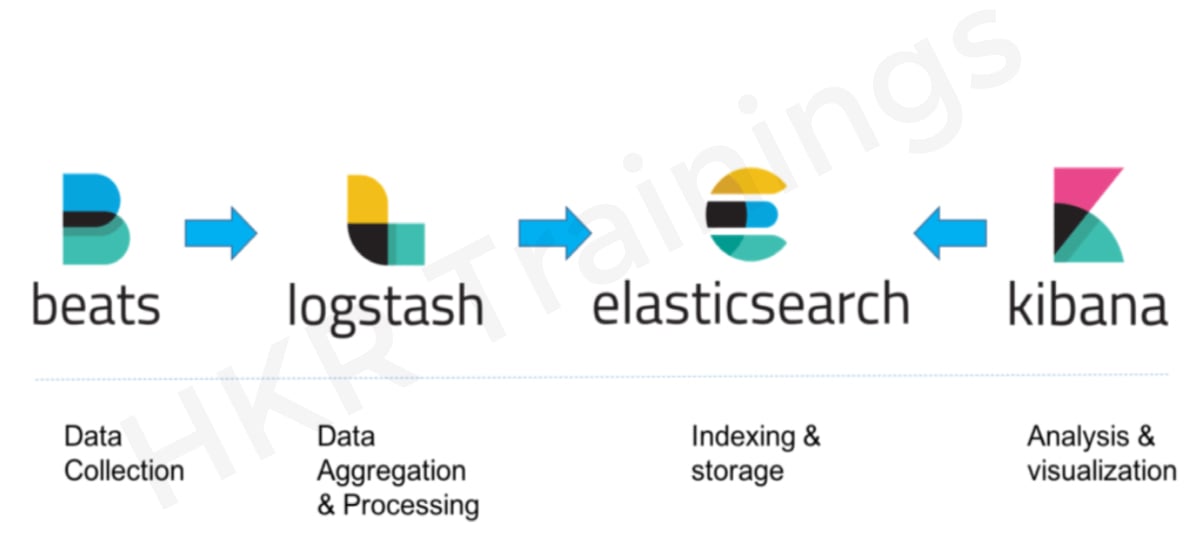
Based on the Apache Lucene search engine, Elasticsearch is an open-source full-text search and analysis engine. Logstash is a log aggregator that gathers data from several sources, applies different transformations and improvements to it, and then sends it to one of the several supported performance destinations. Kibana is a visualization layer built on top of Elasticsearch that allows users to analyze and visualize their results. Finally, Beats are lightweight agents that are built on edge hosts to capture various forms of data for forwarding into the stack.
These various modules are often used to track, troubleshoot, and secure IT environments when used together (The ELK Stack has even other applications, such as business intelligence and web analytics.). Beats and Logstash gather and process data, Elasticsearch indexes and save it, and Kibana offers a user interface for querying and visualizing it.
Why is ELK so well-known?

The ELK Stack is well-known because it solves a weakness in the log management and analytics industry. Monitoring modern applications and the IT infrastructure on which they are deployed necessitates log management and analytics solutions that allow engineers to resolve the difficulties of monitoring highly distributed, complex, and noisy environments.
The ELK Stack assists users by offering a powerful framework that gathers and processes data from various data sources, stores it in a centralized data store that can scale as data expands, and offers a range of tools for data analysis.
The ELK Stack is, of course, open-source. The prominence of the stack may be explained by the fact that IT organizations prefer open-source products. Organizations can prevent vendor lock-in and onboard new talent even more effectively when they use open source. Isn't it valid that everybody knows how to use Kibana? Open source also involves a flourishing culture that is continually pushing new features and creativity while also supporting in times of need.
Splunk has been a market leader in this domain for a long time. However, its numerous features are increasingly not worth the high cost, especially for smaller businesses such as SaaS products and tech startups. Splunk has around 15,000 users, but ELK is downloaded more than Splunk's overall customer count in a single month — and several times over. ELK does not have all of Splunk's functionality, but it doesn't include those analytical bells and whistles. ELK is a low-cost log management and analytics application that is both simple and efficient.
Learn new & advanced Architectures in ELK Stack with hkr's ELK Stack online course !

SIEM Training
- Master Your Craft
- Lifetime LMS & Faculty Access
- 24/7 online expert support
- Real-world & Project Based Learning
What Is the Significance of Log Analysis?
Organizations cannot afford a single second of downtime or slow application efficiency in today's competitive environment. Efficiency issues can harm a brand and, in some cases, result in direct revenue losses. Businesses cannot afford to be compromised for the same purpose, and refusing to comply with regulatory requirements will result in heavy penalties and impact a company just as much as a performance issue.
Engineers rely on the various types of data created by their applications and the infrastructure that supports them to ensure that apps are always accessible, performant, and stable. This data, whether in the form of event reports, metrics or both, allows for system monitoring and the recognition and resolution of issues as they arise.
Logs, like the numerous methods for analyzing them, have always existed. The underlying design of the environments that generate these logs, on the other hand, has changed. Microservices, containers, and orchestration infrastructure are now being implemented on the cloud, across networks, and in hybrid environments. Furthermore, the sheer volume of data produced by these environments is continually increasing, presenting a challenge in and of itself. The days of an engineer being able to SSH into a computer and grep a log file are long gone. This is impossible in environments with hundreds of containers producing terabytes of log data every day.
This is where unified log management and analytics solutions like the ELK Stack come in, offering engineers like DevOps, IT Operations, and SREs the visibility they need to ensure apps are still accessible and performant.
The following core capabilities are included in modern log processing and analysis solutions:
- Aggregation – The ability to compile and send logs from several data sources.
- Processing – the opportunity to convert log messages into usable data for evaluation.
- Storage – the opportunity to preserve data for long periods for tracking, trend analysis, and security applications.
- Analysis – The ability to query data and build visualizations and dashboards on top of it to interpret it.
How to Analyze Logs Using the ELK Stack?
As discussed earlier, the various components of the ELK Stack when combined provide a basic but efficient solution for log management and analytics.
The ELK Stack's different components were built to connect and play well with one another without requiring too much extra setup. Though, depending on the environment and use case, how you build the stack can vary greatly.
The typical design for a small development environment would look like this:

Additional components are likely to be applied to the logging infrastructure for resiliency (Kafka, RabbitMQ, Redis) and security (nginx) to handle more complex pipelines designed for processing massive volumes of data in production:

SIEM with the ELK Stack :
Log data is at the core of every SIEM scheme. There was a lot of it. If they come from servers, firewalls, databases, or network routers, logs provide analysts the raw material they need to understand what's going on in an IT world.
However, some critical steps must be completed before this content can be converted into a resource. Data must be gathered, analyzed, normalized, enhanced, and preserved. These measures, which are commonly grouped as "log management," are an essential part of any SIEM system.
It's no surprise, then, that the ELK Stack — the world's most common open-source log analysis and management tool — is integrated into the majority of open-source SIEM solutions. ELK is part of the infrastructure for OSSEC Wazuh, SIEMonster, and Apache Metron, and is responsible for data processing, parsing, storage, and analysis.
The ELK Stack could be deemed a viable open-source approach if log management and log interpretation were the only components in SIEM. However, in addition to log management, a long list of components was specified when we established what a SIEM system is. This post would attempt to elucidate whether the ELK Stack can be used for SIEM, what is missing, and what is needed to transform it into a fully functional SIEM solution.
Log Collection
SIEM schemes, as previously discussed, require aggregating data from various data sources. These data sources can differ based on the context, but you'll most likely be pulling data from your application, infrastructure (servers, databases), security measures (firewalls, VPNs), network infrastructure (routers, DNS), and external security databases (e.g. thread feeds).
This necessitates aggregation features, which the ELK Stack excels at. You may build a logging architecture consisting of several data pipelines by merging Beats and Logstash. Beats are small log forwarders that can be installed on edge hosts as agents to track and forward different types of data. Filebeat is the most familiar beat, and it is used to forward log data. The data from the beats will then be aggregated, processed (see below), and forwarded to the next component of the pipeline using Logstash.
Multiple Logstash instances would almost certainly be needed to maintain a more resilient data pipeline due to the volume of data involved and the various data sources being tapped through. Not just that, but a queuing process would be needed to ensure that data bursts are managed and that data is not lost due to breakdowns between the pipeline's different components. In this sense, Kafka is often used, and it is built before Logstash (other tools, such as Redis and RabbitMQ, are also used).
As the company and the data it produces expand, the ELK Stack will almost certainly become insufficient. If a company decides to use ELK for SIEM, it must be aware that additional components will be required to complete the stack.
Top 30 frequently asked SIEM Interview Questions and Answers!

Subscribe to our YouTube channel to get new updates..!
Log Processing
Logstash's role in a logging pipeline includes more than just collecting and forwarding data. Processing and parsing data is another critical challenge and one that is equally critical in the sense of SIEM.
Many of the above data source types produce data in various formats. The data must be normalized to be accurate in the next step, which is finding and evaluating it. This involves segmenting log messages into valid field names, correctly mapping field types in Elasticsearch, and enriching unique fields as appropriate.
The significance of this step cannot be exaggerated. Your data would be useless if you want to evaluate it in Kibana without correct parsing. Logstash is an excellent asset to have on the team for this critical mission. Logstash will split up the logs, enrich individual fields with geographic knowledge, for example, drop fields, add fields, and more, thanks to a wide range of various filter plugins.
A logging architecture, such as the one needed by a SIEM framework, may become very complex. You'll need several Logstash configuration files and instances to configure Logstash to manage various log styles. Logstash output is hindered by heavy processing caused by complicated filter configurations. Monitoring Logstash pipelines is essential, and there are monitoring APIs available for this purpose, such as the Hot Thread API for detecting Java threads with high CPU use.
Storage and Retention
The log data collected from the different data sources must be stored in a data store. The data indexing and storage part of ELK is Elasticsearch.
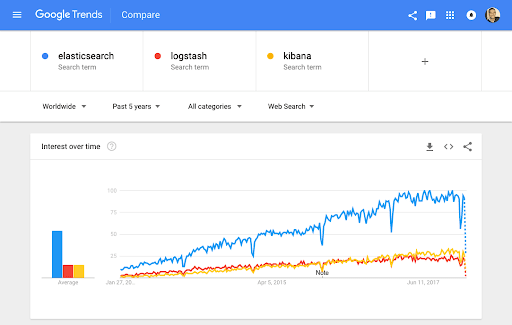
Elasticsearch is a common database nowadays, and it is the second most downloaded open-source program after the Linux kernel. This popularity stems from a range of factors, including the fact that it is open-source, relatively simple to set up, fast, scalable, and supported by a wide community.
Creating an Elasticsearch cluster is just the first step. Since we're talking about indexing vast volumes of data that would almost inevitably expand in volume over time, every Elasticsearch deployment used by SIEM must be highly scalable and fault-resistant.
This necessitates a set of distinct sub-tasks. We already discussed using a queuing system to avoid data loss in the event of disconnects or data bursts, but you can also track main Elasticsearch efficiency metrics including indexing rate and node JVM heap and CPU. Again, you should use a tracking API for this. Capacity preparation is also critical because if you're using the cloud, you'll almost certainly need an auto-scaling strategy to ensure you have enough resources to index.
Another factor to remember is retention.
A long-term storage strategy is needed for effective after-the-fact forensics and investigation. If you observe a huge spike in traffic from a single IP, for instance, you can compare this historical data to see if this is unusual behavior. Some attacks can take months to develop, and getting the historical data as an analyst is essential for detecting patterns and trends.
Unnecessary to mention, the ELK Stack does not have an archiving feature out of the box, so you'll have to formulate your data retention plan. Ideally, one that would not put the company in financial trouble.
Querying
The next move is to query the data after it has been collected, parsed, and indexed in Elasticsearch. You can do this with the Elasticsearch REST API, but you're more than definitely going to use Kibana.
Querying data in Kibana is achieved with Lucene syntax. Field-level searches, for instance, are a typical search category. For instance, let's assume I'm searching for all log messages created by a particular person in the company. I may use this basic question since I normalized a field called username through all data sources:
username:”Daniel Berman”
This search style may be combined with a logical argument, such as AND, OR, or NOT.
username:”Daniel Berman” AND type:login ANS status:failed
Again, if you want to use the ELK Stack for SIEM, you'll need to use Logstash's parsing ability to process the results, and how well you do that will determine how easy it is to query through the various data sources you've tapped into.
Dashboards
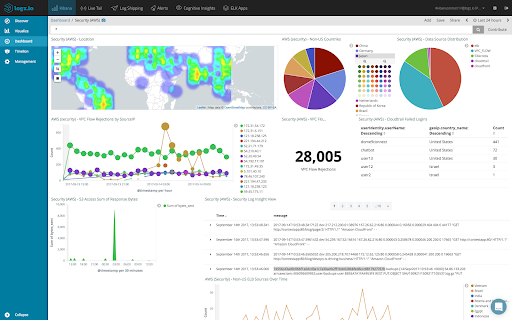
Kibana is known for its visualization tools, which provide a wide range of visualization styles and the ability for developers to slice and dice their data however they choose. The results are very effective, and you can produce pie charts, graphs, geographical maps, single metrics, data tables, and more.
For an AWS world, here's an example of a SIEM dashboard developed in Kibana:

Creating dashboards in Kibana is a dynamic activity that necessitates detailed comprehension of the data as well as the various fields that constitute log messages. More importantly, there are certain features that Kibana lacks, such as dynamic linking within visualizations. There are workarounds, so having built-in features will be extremely beneficial.
Kibana still doesn't allow for safe object sharing. The share connections in Kibana are not tokenized if you discover a security violation and wish to share a dashboard or a single visualization with a colleague. There are proprietary add-ons (X-Pack) and open source implementations that can be used on top of Kibana.
Correlation
Event correlation is another important component of SIEM. As we discussed in a previous article, event correlation is the process of connecting signals from various data sources to form a trend that may indicate a security breach. The basic sequence of events that make up this pattern is specified by a correlation rule.
For instance, a rule may be written to detect when unique IP ranges and ports send a certain number of requests in a certain period. Another correlation rule would search for an exceptionally high number of failed logins in accordance with the development of privileged accounts.
Various SIEM tools include these correlation rules, which are predefined for various attack scenarios. Since the ELK Stack lacks built-in correlation rules, the analyst must rely on Kibana queries that depend on Logstash sorting and processing to compare events.
Alerts
Excluding alerts, correlation rules are pointless. SIEM systems depend on being notified when a potential attack pattern is discovered.
Following up on the previous scenarios, whether the device logs a significant number of requests from a certain IP set, or an unusual number of failed logins, an alert should be sent to the appropriate individual or team within the company. The sooner a notice is sent out, the more likely it is that successful mitigation will occur.
The ELK Stack does not have an alerting feature in its open-source version. The ELK Stack must be supplemented with an alerting addon or add-on to provide this functionality. X-Pack is another choice. ElastAlert, an open-source platform that can be used on top of Elasticsearch, is another alternative.
Incident Management
The concern has been detected, and the analyst has been informed. So, what's next? The result can be decided by how well your company reacts to the incident. SIEM systems are configured to assist security analysts with the incident's next moves, such as containing it, escalating it if possible, reducing it, and searching for vulnerabilities.
The ELK Stack is excellent at assisting analysts in identifying events, but it falls short when it comes to handling them. And if an alerting add-on is applied to the stack, event control needs a way to handle the triggered alerts. Otherwise, you are drowning in messages and skipping crucial activities. Automating the escalation and ticket production processes is often crucial for effective event management.
Conclusion
The ELK Stack is effective in addressing problems with centralized logging schemes. Elasticsearch, Logstash, and Kibana are among the freeware applications used. Elasticsearch serves as a NoSQL database, Logstash is a data collection tool, and Kibana is a data visualization tool. This blog has given you all of the essential details you need to know about the ELK Stack.
Related Articles:
About Author
A technical lead content writer in HKR Trainings with an expertise in delivering content on the market demanding technologies like Networking, Storage & Virtualization,Cyber Security & SIEM Tools, Server Administration, Operating System & Administration, IAM Tools, Cloud Computing, etc. She does a great job in creating wonderful content for the users and always keeps updated with the latest trends in the market. To know more information connect her on Linkedin, Twitter, and Facebook.
Upcoming SIEM Training Online classes
| Batch starts on 13th May 2026 |
|
||
| Batch starts on 17th May 2026 |
|
||
| Batch starts on 21st May 2026 |
|


