What is Tableau?
Tableau is one of the best business intelligence tools developed and implemented to perform all the functionalities and operations related to the visualization of data in the organization. It helps in simplifying and organizing the available organizational data into an easily understandable format. The Tableau also allows non-technical users to create customized dashboards. The data visualization in Tableau is performed by using the dashboards and worksheets. The data analysis process is very fast in Tableau, avoiding any confusion to the business teams in the organization. Hence, it is called as the rapidly growing data visualization tool using the different ways of representation of the data via charts, graphs, plots etc. This kind of graphic provides the flexibility to the users to quickly analyze and make appropriate decisions that would benefit the business and lead to the growth and development of the organization as well.
Take your career to next level in Tableau with HKR.Join Tableau Training now.
What is a Power BI?
Power BI is a business intelligence platform developed by Microsoft to perform the functionalities related to the data like analyzing, visualizing, aggregating and sharing the data. Hence, Power BI is called as the business intelligence analytics and cloud-based reporting tool that helps in connecting the users to a broad range of data through different data sources, dashboards, and visualizing the data. Power BI platform has come up with an advantage to keep yourself away from any worries about the file versions, data refreshes, providing an opportunity to the users to access the reports from anywhere via a system or a mobile device at any point of time. The Power BI tool also comes up with the ability to embed the reports directly in the webpages. In short, Power BI is a data visualization tool that helps you in converting the data obtained from different sources to interactive dashboards and BI reports. Let us have a quick review of the differences between Tableau and Power BI in all aspects.
Become a Power BI Certified professional by learning this HKR Power BI Training !
History of Power BI and Tableau
Power BI
Power BI is a popular business intelligence and data analytics tool with easy to use drag-and-drop features. It is a Microsoft product originally designed by Ron George for interactive data visualization in 2010. In 2011, it came into public use. It is much faster and performs well when the data volume is limited. The key components of Power BI include Power BI Service, Power BI Desktop, Power BI Gateway, Mobile Server, etc.
Further, it offers many cloud-based services with intuitive visualizations for the end users through a simple interface. It enables them to build various reports and dashboards. Therefore, using Power BI is very helpful for many users.
Tableau
Tableau was designed by three researchers- Pat Hanrahan and two others in 2003. It is designed to make the database industry more comprehensive and interactive. Moreover, Tableau emerged as a popular data visualization tool among the competitors like MS Excel, Cognos, etc. It is user-friendly and simple to use, the tool through which users can create charts, graphs, reports, etc. Tableau is designed using VizQL language, which makes it flexible to extract data from different sources. Also, it emerged as a real-time data analytics tool.
If you want to Explore more about Tableau? then read our updated article - Tableau Tutorial

Tableau Certification Training
- Master Your Craft
- Lifetime LMS & Faculty Access
- 24/7 online expert support
- Real-world & Project Based Learning
Tableau vs Power BI
Key differences between Tableau and Power BI:
Data Visualizations:

Tableau:
Tableau allows the creation of different kinds of base type visualizations that include charts, heat maps, line charts, and scatters plots. Tableau users do not require any technical knowledge or coding to develop or create visualizations.
Power BI:
Power BI is the tool that helps in uploading the data sets at a breeze. In Power BI, the users are allowed to choose the visualizations as blueprints and insert the data from the sidebar into visualization. Power BI allows the users to create the visualizations by asking the queries using the natural language. Power BI setup a data limit of 3500 when it comes to drilling down into datasets.
Related Article: Tableau Versions
Cost/Pricing:

Tableau:
Tableau offers subscription plans to the users based on their needs. The prices are specified based on the user on a monthly or annually basis. It also provides a 14 day trial for the users who would like a test before they purchase Tableau. It costs around $35 per user, per month for on-premise deployment and $42 per user, per month if deployed in the cloud.
Power BI:
Power BI offers different plans based on the subscription tiers: Desktop, Pro and Premium. The desktop version is free for individual users. The pro subscription plan starts at $9.99 per user, per month and also includes some additional features like content packaging, distribution along with data governance. The premium plan starts around $4,995 a month per dedicated cloud compute. Pro version also offers a free trial period of 60 days.
Data Sources:

Tableau:
Tableau is capable of providing its extensive support for hundred of data connectors like OLAP and Big Data options. Tableau is capable of determining the relationships when the users add the data. Tableau also allows modification of the data links or create them manually based on the organizational decisions.
Power BI:
Power BI is also capable of connecting to the user's external sources like sap, MySQL etc. Power BI is also capable of determining the relationships automatically when the users add the data. It also allows the users to connect to Microsoft Azure databases, files, third-party databases and online services.
Customer support:

Tableau:
Tableau allows direct support to the users using phone and email. It also uses the advanced version of logging the tickets in the customer portal and resolve them as quickly as possible. The users are allowed to access the Tableau community forum and attend the training sessions if needed.
Power BI:
The customer support functionality is limited for the users in Power BI who have a free BI account. Every user of Power BI is allowed to submit the tickets. However, the users who have a paid account will receive the support first followed by the other users. Power BI offers documentation, support resources with a guide and user community forums as well.
Setup:

Tableau:
Tableau allows you to set up your initial instance through a free trial. This will give you complete access to the parts of the tool. You will be able to view the opening dashboard, which includes a list of the available connections. You can start connecting your data sources and build the worksheet where the visualizations will be live.
Power BI:
Power BI comes up with three different forms which would be via mobile, desktop or service. Based on the roles and needs, you can select any one of these to build and publish the visualizations. The most important is the Azure tenant setup that you need to connect to your Power BI using Office 365 Admin interface. It helps in quickly connecting to the spreadsheets, data sources and applications using the built-in connections and application programming interfaces.
Dashboards:

Tableau:
Tableau has come up with powerful features which include forecasting based on past behaviour, calculations to transform the existing data based on the needs. It is capable of extracting and also provides the drag and drop table view to ask the questions of the data.
Power BI:
Power BI has also come up with the drag and drop functionality along with the real-time access to the data. Power BI helps in speeding up the visualizations and gives the users access to powerful data analytics and discovery. Power BI is flexible to react with the teams instantly based on the dynamic changes that happen during the business developments and requirements.
Products offered:
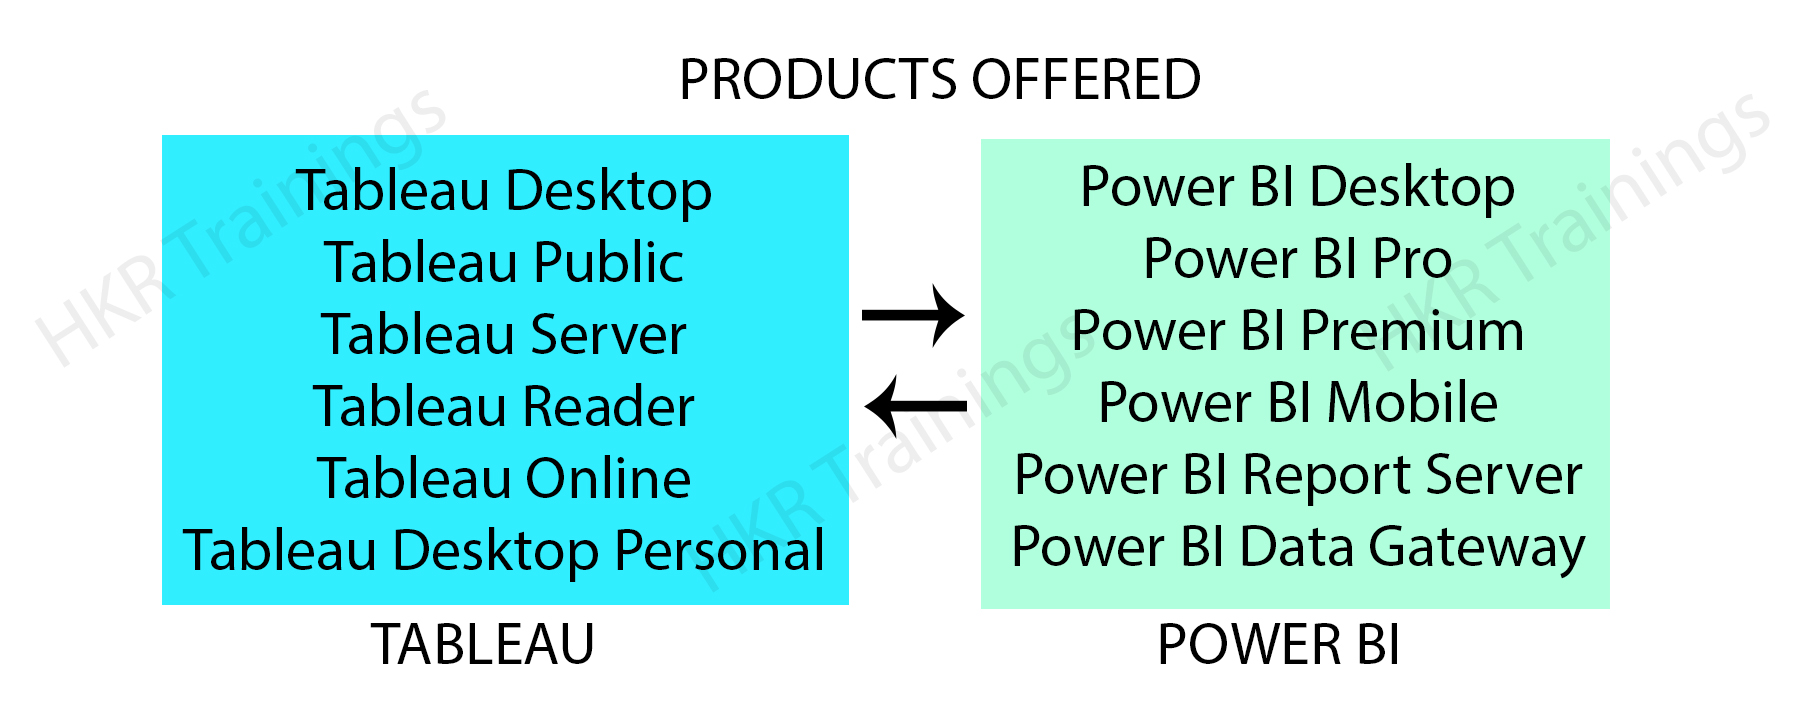
Tableau:
- Tableau desktop
- Tableau desktop personal
- Tableau Desktop Professional
- Tableau Public
- Tableau Server
- Tableau Online
- Tableau Reader
Power BI:
- Power BI service
- Power BI Desktop
- Power BI report server
- Power BI data gateway
- Power BI mobile apps
Integration:

Tableau:
Tableau has come up with many connectors and integrations. It allows you to view all the connectors on your dashboard. However, since Tableau's connections are more closely connected, it needs to identify the data that you want to pull into the dashboard before making a connection.
Power BI:
Power BI also has access to many Application programming interfaces with the in-built dashboards for insights. It helps you in connecting with some popular technologies like Salesforce, Email platforms, Google analytics, Microsoft products, etc.
Machine learning:

Tableau:
Tableau includes Python machine learning capacities that are in-built and making it proficient in performing the machine learning operations over the data sets.
Power BI:
Power BI is integrated with Microsoft Azure which helps in performing the analysis of the data and understanding the trends and patterns of the business/ products.
Data Capacity:

Tableau:
Tableau is designed and developed in such a way that it works on a columnar based structure that includes storing the unique values allowing to fetch billions of rows.
Power BI:
Each workspace/group could allow handling only 10 GB of data. For the data that is more than 10 GB, the information needs to be in the cloud(Azure), Power BI selects and pulls the data from the database.
Ease of Using Power BI and Tableau:
Tableau
It provides an easy-to-use interface with many additional capabilities, including visualizing and exploring data in detail. Tableau also integrates NLP capabilities into the software that helps in finding better solutions to various issues.
Power BI
Power BI's user interface provides an easy-to-use feature based on MS Office 365. Many end-users use this Microsoft product actively.
Programming Support:
Tableau
Tableau offers smooth integration with programming languages like R. Further, we can implement Tableau SDK using the following programming languages: Java, Python, C, and C++. These programming tools support building more robust and interactive visualizations.
Power BI
Power BI also connects with the R language but could provide a better integration like Tableau. For this, it requires Microsoft Revolution Analytics which is only useful for enterprise-level users. It supports data analysis expressions for modeling data and its manipulation. Further, it also supports M programming language for smooth integration.
Google Trends:
Tableau
According to Google Trends, a Tableau is a popular tool extremely searched over the internet. It has several users across industries.
Power BI
As per Google Trends report, Power BI is a comparatively less searched tool over the internet. It has a lower search volume.
Functionality:
Tableau
Tableau functions better than Power BI when it comes to answering multiple queries.
Power BI
It doesn't have such functionality in comparison to Tableau.
Deployment:
Tableau
We can deploy Tableau on both spaces on-premise and on-cloud. It works well when there is huge data available on the cloud.
Power BI
Power BI is a SaaS model available in both cloud and on-premise versions. But it is only limited to the Azure cloud, which limits the Power BI's service flexibility.

Subscribe to our YouTube channel to get new updates..!
Features:
Tableau and Power BI have come up with the features that are used by almost every organization. Let us have a quick review of them individually.
Tableau: Some of the features of Tableau are listed below:
- Tableau allows sharing of the dashboards.
- Tableau does not require any technical knowledge.
- Tableau provides real-time analysis of data.
- Allows dashboard commenting.
- Collaborates the data and enables data notifications
- Helps in highlighting the data and filter accordingly.
- Tableau provides mobile-ready dashboards.
- Involved DAX analysis function
- Allows toggle viewing and drag-and-drop functionality
- Includes translation of the queries into visualizations
- Capable of importing all sizes and ranges of data.
- Tableau includes tableau reader for data viewing.
- Embed the dashboards within.
- Consists of a list of native data connectors
Power BI: Some of the features of Power BI are listed below.
- Allows customization of dashboards.
- Helps in Online analytical processing
- Power BI generates data sets, reports.
- Includes content packs that help in sharing the dashboards within the teams.
- Power BI provides help and feedback buttons.
- Power BI consists of a Q&A question box.
- Involves ad hoc reporting and analysis
- Offers Power BI embedded, azure service allowing the applications to interact with Power BI
- Real-time dashboards are helping the business owners to solve the problems as they come in.
Advantages of Tableau and Power BI:
Tableau and Power BI have come up with benefits, let us gain an understanding of the advantages of both of the tools individuals.
Tableau:
- Tableau comes up with less cost of training.
- Tableau is very fast and easy to create visualizations.
- Tableau makes use of scripting languages like R and Python to avoid performance issues for complex problem calculations.
- Tableau provides good customer support.
- Tableau offers the visualization feature
- Allows creating the reports, stories and dashboards using Tableau desktop.
- Capable of handling a large amount of data.
- Tableau is a very easy tool to learn.
- It enables users to clean and analyze data to make data analysis.
- If you have a medium knowledge of Excel, then you can easily use Tableau.
Power BI:
- Allows data exploration using the natural language query.
- Power BI provides real-time dashboard updates.
- Allows adding new features frequently.
- Power BI offers a secure and reliable connection to the data sources in the cloud.
- Power BI offers a hybrid configuration and quick deployment within a safe environment.
- Integrated with languages like R and Python to use visualizations.
- Capable of backing up.
- Includes the extensive database connectivity capabilities Q&A features publish to the web.
- It provides many pre-built dashboards and reports making them available for SaaS solutions.
- Also, it holds a dashboard visualization feature.
- Power BI offers a reliable and secure connection for the data sources on-cloud and on-premises.
- Further, it provides a secure environment fot faster development.
Click here to get latest Tableau Interview Questions and Answers for 2024
Disadvantages of Tableau and Power BI:
Every tool or software would have some limitations or drawbacks that have to be improved in future versions. Let us have a quick review of the disadvantages of Tableau and Power BI individually to understand more about them.
Tableau:
- Relatively high cost than the other BI reporting tools.
- Tableau does not include change management, static.
- Importing the custom visualizations is found to be complicated.
- Specifically suitable only for large organizations.
- Offer complex methods for embedding the reports to the other applications.
- Integrated with other Microsoft applications like Microsoft Flow, Dynamics 365, Office 365 that uses SSO ( Single Sign-On).
- Tableau does not provide its support to artificial intelligence and machine learning.
- Tableau is a very easy tool to learn.
- It enables users to clean and analyze data to make data analysis.
- If you have a medium knowledge of Excel, then you can easily use Tableau.
Power BI:
- Power BI allows sharing of the dashboards and reports only with the users having the same email domains.
- Does not accept files that have the file size larger than 1 GB.
- Power BI does not allow mixing of imported data.
- Dashboards never accept or pass the user, account or any other parameters.
- The Power BI Desktop version doesn't support iOS.
- It is also challenging to process large data sets with many features.
Conclusion
Tableau and Power BI have their significance in the Business Intelligence industry. It is your choice to select the right platform for your business based on your business needs and requirements. I hope the above information is helpful for you. I am sure this information will help you identify the right tool for data visualization easier for your business. Learning more about business intelligence tools is a plus these days. As everything is getting advanced and running around the data, data analytics is playing a vital role in the current times. I would recommend you to get trained and certified in the business intelligence tools that will help you gain more knowledge and lead a prosperous career ahead in the world of business intelligence.
Related Articles:
About Author
As a senior Technical Content Writer for HKR Trainings, Gayathri has a good comprehension of the present technical innovations, which incorporates perspectives like Business Intelligence and Analytics. She conveys advanced technical ideas precisely and vividly, as conceivable to the target group, guaranteeing that the content is available to clients. She writes qualitative content in the field of Data Warehousing & ETL, Big Data Analytics, and ERP Tools. Connect me on LinkedIn.
Upcoming Tableau Certification Training Online classes
| Batch starts on 26th Feb 2026 |
|
||
| Batch starts on 2nd Mar 2026 |
|
||
| Batch starts on 6th Mar 2026 |
|
FAQ's
Power BI is considered easier for new users who need to gain skills in data analysis. Tableau is best suitable for experienced data analysts. Power BI deals with limited data volume.
Tableau is much faster and quickly adaptable. It can handle large sets of data much faster and offers better performance. Also, it helps to build interactive data visualizations much more quickly. Therefore, it costs more than Power BI.
Tableau is a powerful data visualization tool that gives in-depth insights. It is much more user-friendly and doesn't need coding or technical skills.
Yes, a person with a non-technical background can also learn Tableau easily, as it doesn't need coding experience.
There are different types of Tableau- Tableau Desktop, Tableau Public, Tableau Server, Tableau Online, and Tableau Online.

