
SAS BI Tools
Last updated on Nov 07, 2023

Overview of SAS Business Product
SAS Enterprise Business Intelligence (BI) is a collection of tools for preparing and presenting results. Here's a brief summary of the SAS BI product names and their functions.
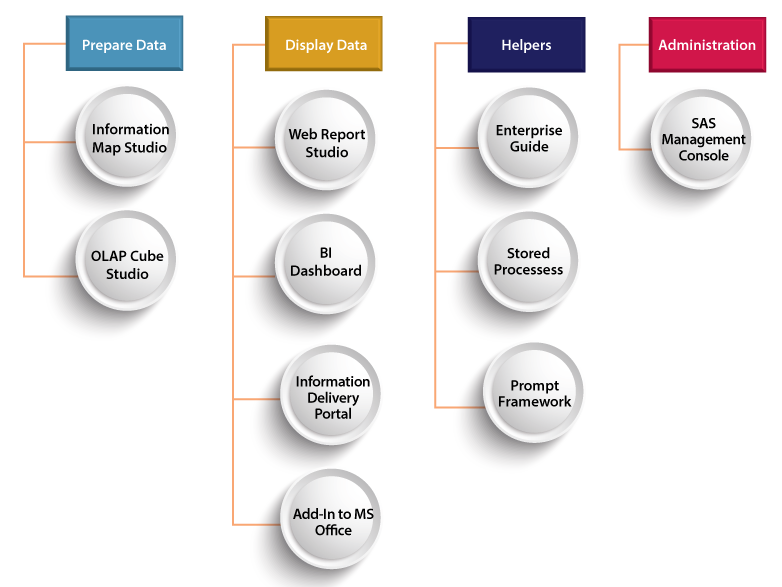
Prepare Data
It's conceivable that your data is stored in a relational database (Oracle, Teradata, MySQL, etc). The data is then stored in OLAP cubes, information maps, or, in some cases, SAS datasets so that it can be displayed in BI software. Some users use SAS Data Integration (DI) Studio, which is another SAS product, to build their extract transform load (ETL) operation.
SAS OLAP Cube Studio
- Create OLAP cubes that are based on MDX code. OLAP cubes allow users to easily display and drill down to desired details by summarising large datasets. SAS Information Map Studio.
- DBMS (Oracle, Teradata, DB2), SAS datasets, and OLAP cubes are used to construct knowledge maps. Data can be joined, variables can be renamed, and the data can be presented in a business-friendly format using information maps.
Display and Use Data
Data can be joined, variables can be renamed, and the data can be presented in a business-friendly format using information maps.
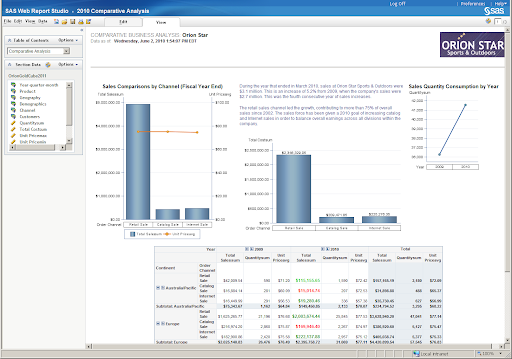
SAS Web Report Studio
Reports can be generated using OLAP Cubes, Info Maps, or SAS datasets. End-users can easily review reports and drill down to other reports using a simple, easy-to-use interface.
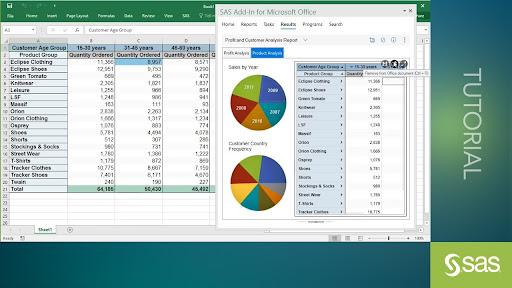
SAS Add-In for Microsoft Office
- In MS-Excel – OLAP Cubes, information maps, and SAS datasets can all be used to create reports. Combine SAS data with Excel spreadsheet data.
- In MS Office/PowerPoint – Reports can be created using cubes, information maps, or datasets. While it lacks the flexibility of MS Excel, it is simple to build reports that can be shared with other applications.
- It's possible to build data in MS Excel and save it to the cloud, which you can then use in other BI software. This will be a strong alternative for smaller datasets that are modified infrequently and aren't stored centralized, such as a branch organization framework.
SAS BI Dashboard
Build dials, maps, and even moving indicators with the summarised data.
SAS Information Delivery Portal
In one place, you can access all of your Web Report Studio reporting, archiving procedures, and publishing platforms, as well as external web pages.
Helpers
SAS Enterprise Guide
- Connect to SAS datasets, RDBMS databases, and even spreadsheets in Excel. To use and view data, build stored procedures.
- OLAP Cubes, Info Maps, and SAS datasets can be used to create reports and more.
- Develop reports that can be exchanged with other SAS resources as a stored procedure.
SAS Prompt Framework
SAS Enterprise Guide and stored processes are also included. Users may be prompted or answered questions using prompts, and data can be returned depending on their responses.
SAS Stored Processes
Build SAS systems to transfer data around, produce reports, or simply ensure prompts are accessible in information maps.
Administration
SAS Management Console
You may use it to manage the system and restrict data access. You may use it to manage the system and restrict data access.
BI Clients Used by Information Technology
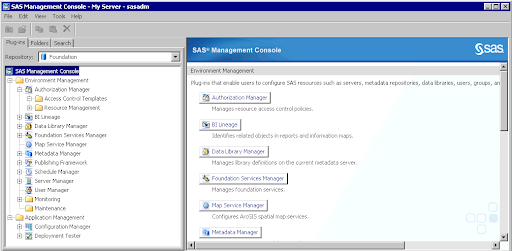
1. SAS Management Console
SAS Management Console is a platform that can be used to enable a number of plug-ins. A plug-in is an interface module that generates and preserves metadata for a particular resource class. The Server Manager plug-in, for instance, is used to identify SAS servers by creating and updating metadata. Additional features are included in some plug-ins. The Server Manager plug-in, for instance, allows you to interrupt, pause, and restart servers as well as track their operation.
Plug-ins can only be accessed and used by those people. Access to plug-ins is determined by the functions to which a user is assigned and the skills assigned to those roles. Initial Roles, Groups, and Users Overview. The Plug-ins tab appears in the left pane when you open SAS Management Console and connect to a metadata server and are allowed to use plug-ins, as seen in this example:
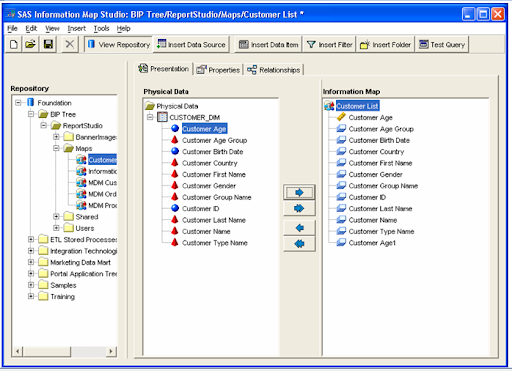
2. SAS Information Map Studio
SAS Information Maps are business-oriented metadata that define a data warehouse. This gives you the opportunity to surface data from a ubiquitous data warehouse to business users in the sense of how they operate. SAS Information Map Studio serves as a link between your data warehouse and the end-user creating reports from it.
The SAS Metadata Server is responsible for metadata management and protection, while the SAS Web Report Studio product allows users to generate reports. SAS Information Map Studio is a Java software for creating, editing, and handling SAS Information Maps. The framework is compatible with the various Windows operating systems such as Windows NT, Windows 2000, Windows XP.
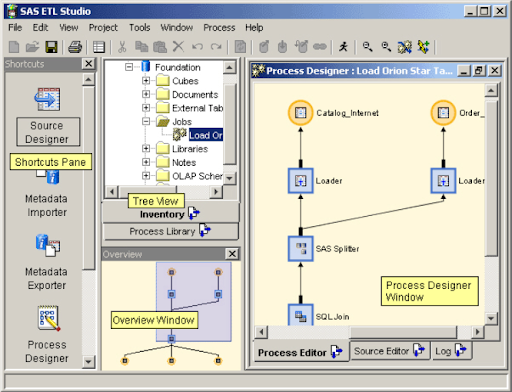
3. SAS ETL Studio
SAS ETL Studio is a Java client for handling ETL processes. Several “ease-of-use” features are included in the interface such as:
- copy the text and paste it into any text field
- You may have several windows open at the same time (Multiple process flow diagrams are included.)
- The appearance and feel of the windows
- user interfaces that are driven by wizards.
Toolbars and pull-down menus are used extensively in SAS ETL Studio. The icons on the toolbar change depending on which interface window is active. The new process-driven functionality is one of SAS ETL Studio's most important features. A Shortcut bar on the far left side of the main SAS ETL Studio window provides access to processes. The SAS ETL Studio Tree View displays various views or "trees" of the current metadata repository and allows you to view the metadata associated with it.
The Process Designer window is where ETL processes are developed. In the Process Designer wizard, the Process Designer view appears as the last phase. The Process Designer view is filled with icons that reflect the chosen processes once the process has been identified. You may use the Process Designer window to:
- View SQL source code.
- Review the SAS log (from submitting jobs).
- View the resulting output from running a SAS job.
The Overview window shows the entire process from the process view. From the Overview window, you can see which part of the process is visible in the Process View window.
4. SAS Web Report Studio
Anyone can display, communicate with, build, and distribute public and private reports using SAS Web Report Studio. Simply open an existing report and work with the data according to the specific requirements. A report, for example, maybe viewed, replied to, or comments added to. Report authors can conveniently query central data sets by pointing and clicking. Alternatively, you can use drag and drop to construct a well-formatted report by inserting prompts and creating the arrangement of tables, graphs, and text. Any of this is done by the use of a web browser. You are not supposed to understand any programming languages. Periodic updates may be programmed to run on a recurring basis, unattended, and then sent out by email.
The following are the prerequisites for SAS Web Report Studio:
- The data performance generation tool is included in SAS BI Report Services. You can produce pre-generated, static copies of reports from the command line using the report output generation tool (rptbatch.bat for Windows and rptbatch.sh for UNIX and z/OS). The report performance generation method now contains additional parameters.
- The SAS BI Report Resources Setup builds libraries that SAS Web Report Studio and the report performance generation tool can access. The query cache library and the delivery library are two of these collections.

SAS Training
- Master Your Craft
- Lifetime LMS & Faculty Access
- 24/7 online expert support
- Real-world & Project Based Learning
BI Clients Used by Power Users
1. SAS Add-In for Microsoft Office
SAS is a Microsoft Office Component Object Model (COM) add-in. SAS data access, analysis, and tracking are all built directly into Microsoft Office software like Outlook, Excel, Word, and PowerPoint. To see how SAS affects these programs, go to the SAS tab or menu.
The SAS Add-In for Microsoft Office 4.3 and 4.305 is compatible with the applications mentioned below:
- Microsoft Word, Excel, and PowerPoint 2003, 2007, and 2010.
- Microsoft Outlook 2007 and 2010.
SAS Add-In 5.1 for Microsoft Office is compatible with the following applications: - Microsoft PowerPoint, Word, Excel, and Outlook 2007, 2010, and 2013.
SAS Add-In 6.1 for Microsoft Office is compliant with the following applications: - Microsoft PowerPoint, Word, Excel and Outlook 2007, 2010, and 2013
SAS Add-In 7.1 for Microsoft Office is compatible with the following Microsoft Office applications: - Microsoft PowerPoint, Word, Excel and Outlook 2007, 2010, and 2013
The SAS Add-In for Microsoft Office 7.12 is compliant with the following applications: - Microsoft PowerPoint, Word, Excel and Outlook 2007, 2010, and 2013
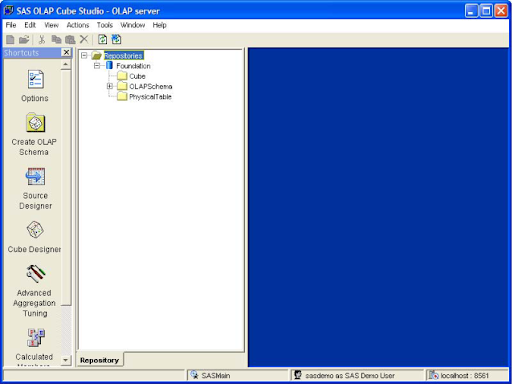
2. SAS OLAP Cube Studio
SAS OLAP Cube Studio is a GUI that allows cube designers to create SAS OLAP cubes quickly and easily. SAS OLAP cubes can be developed, edited, incrementally updated, aggregations tuned, and other changes made to existing cubes. The SAS OLAP Server: User's Guide describes how to use the various roles and functions of the SAS OLAP Server to build SAS OLAP cubes.
SAS OLAP Cube Studio provides a range of resources and functions for making, changing, and preserving OLAP cubes. The Cube Designer wizard, in particular, takes you through the cube-building process. You should define the data used to create the cube, its composition, and the measures and aggregations that would be used to process cube queries. You will see a quick display of your cube after you've designed it in the Cube Designer wizard and double-check your cube data and structure. You will see a quick display of your cube after you've designed it in the Cube Designer wizard and double-check your cube data and structure.
SAS OLAP Cube Studio also includes software for updating and handling cubes. You will make various improvements and modifications to a cube after it has been installed. After a cube has been formed, you can perform the following functions on it:
- The cube's aggregations can be fine-tuned.
- For the cube, you can add and edit calculated members and measures.
- Incrementally update the cube.
- A SAS kit can be exported and then imported between SAS environments.
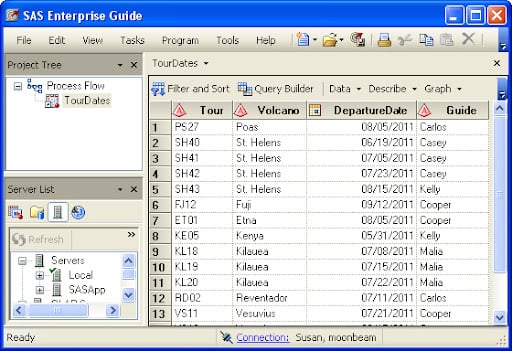
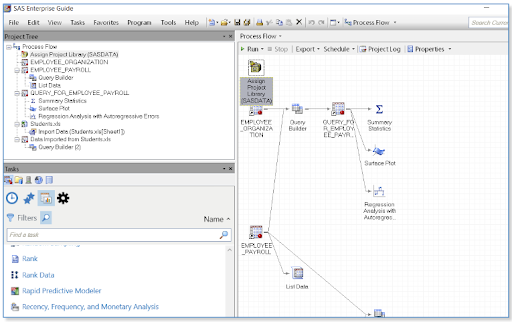
3. SAS Enterprise Guide
SAS Enterprise Guide is a client program for Microsoft Windows that allows you to use SAS in a directed way. SAS Enterprise Guide handles a set of relevant data, activities, code, and outcomes through projects. You may use projects to execute several tasks on the same set of data files and to generate dynamic or ad hoc reports.
SAS Enterprise Guide offers a wide range of report activities and reporting services that SAS IT Resource Management can use to produce analysis and knowledge about the IT capital. You can run the provided reports interactively using the provided IT Resource Management EG projects, or you can build your own.
The SAS Information Map Studio, SAS ETL Studio, and SAS Web Report Studio tools were also used by the Power users.

Subscribe to our YouTube channel to get new updates..!
BI Clients Used by Information Consumers
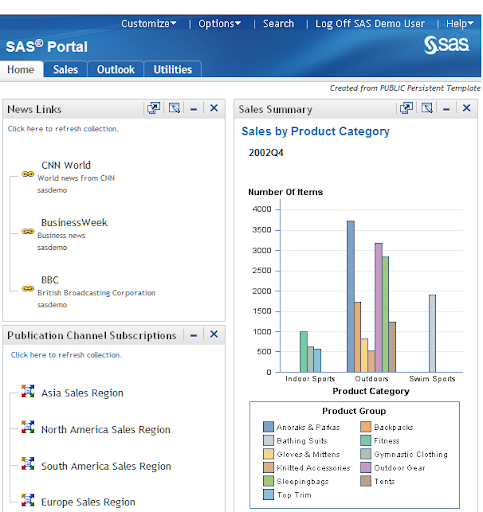
SAS Information Delivery Portal
The SAS Information Delivery Portal is a web-based user interface that allows users to browse and access a large amount of data. Reports, maps, online apps, articles, and connections to internal and external websites are all part of this data. You should set up encryption so that users can only view the details they've been given permission to see.
Portlets are used in the portal to organize information about websites. Here's an example of a gateway with links to websites with industry or world news:
SAS Information Delivery Portal 4.4
The SAS Add-In for Microsoft Office and SAS Web Report Studio tools were also used by the information consumers.
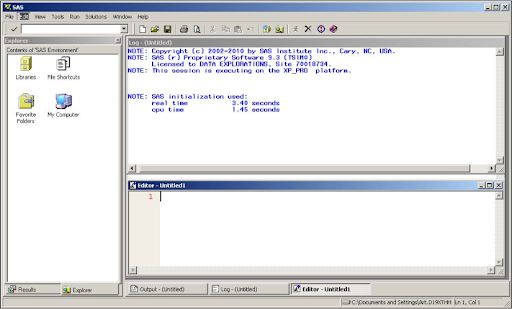
SAS Display Manager
The Display Manager produces a range of windows, screens, and dialogue boxes to help SAS, the Operating System, and the user interact more effectively. Options for controlling the content, display, and level of interaction are available for each of the five primary windows, as well as the dozens of secondary windows. Options have defaults, but most of them can be modified to meet your needs.
The Display Manager can be fully customised. Many of the potential customizations are excessive, but there are a few that are extremely useful. Almost every option has a default value that can be altered. Customize the toolbars and drop-down menus. With the Enhanced Editor, you can run programs with a single keystroke and build shortcuts and editing tools. Most of these customizations are simple, and they only involve a little creativity in terms of what you'd like to change about your workplace.
SAS Enterprise Guide
SAS Enterprise Guide is a menu and wizard-driven tool that allows users to analyse data and publish their findings with a simple point-and-click interface. It enables rapid data audits, generates code for increased efficiency, and speeds up the deployment of evaluations and predictions.
It saves time and money by leveraging SAS investments already in place. With SAS Enterprise Guide, developers can easily build stored processes that can be executed on demand by management and ported to Microsoft Excel using programs they already have. SAS Enterprise Guide is suitable for statisticians, programmers, and analysts – even those with little SAS experience – due to the efficiencies obtained from a workflow environment.
Conclusion
Improved visualisation tools take into account improved versatility, allow us to explore greater volumes of data, and promise to assist companies in evaluating the past, comprehending the current, and forecasting the future in order to make smarter, more profitable decisions. Organizations often construct overviews of their key metrics and build dashboards to monitor their progress. SAS supports both conventional and big data environments throughout the analytics life cycle. SAS BI tools offer market analytics as well as the ability to build dashboards for reliable performance assessment.
About Author
Upcoming SAS Training Online classes
| Batch starts on 3rd Aug 2026 |
|
||
| Batch starts on 7th Aug 2026 |
|
||
| Batch starts on 11th Aug 2026 |
|