
PowerBI with SQL server
Last updated on Jun 13, 2024

What is Power BI?
Power BI is indeed a set of software tools, applications, and interfaces which works together to transform disparate data sources into logical, visualizations, and engaging information. The information could be in the form of an Excel spreadsheet or even a set of blended data warehouses which are both cloud-based and on-premises. Power BI makes it simple to link to various data sources, display and uncover what matters, and share your findings with whomever you choose.
Become a Power BI Certified professional by learning this HKR Power BI Training !
Power BI's elements:
Beginning with the three fundamentals, Power BI is made up of various components working together:
- Power BI Desktop for Windows is a desktop app.
- The Power BI service is a cloud-based SaaS (Software as a Service) application.
- In iOS, Windows, & Android smartphones, there are Power BI mobile apps.
Power BI Desktop, the platform, as well as the mobile applications, are all intended to help you generate, distribute, and utilize market intelligence in the most efficient way possible.Apart from them, Power BI has two more characteristics: the Power BI Report Builder, which allows you to create paginated reports that you can distribute through the Power BI service, and the Power BI Data Warehouse. On-premises data server powered by Power BI. After developing your Power BI reports in Power BI Desktop, you may upload them to Power BI Report Server, a report server.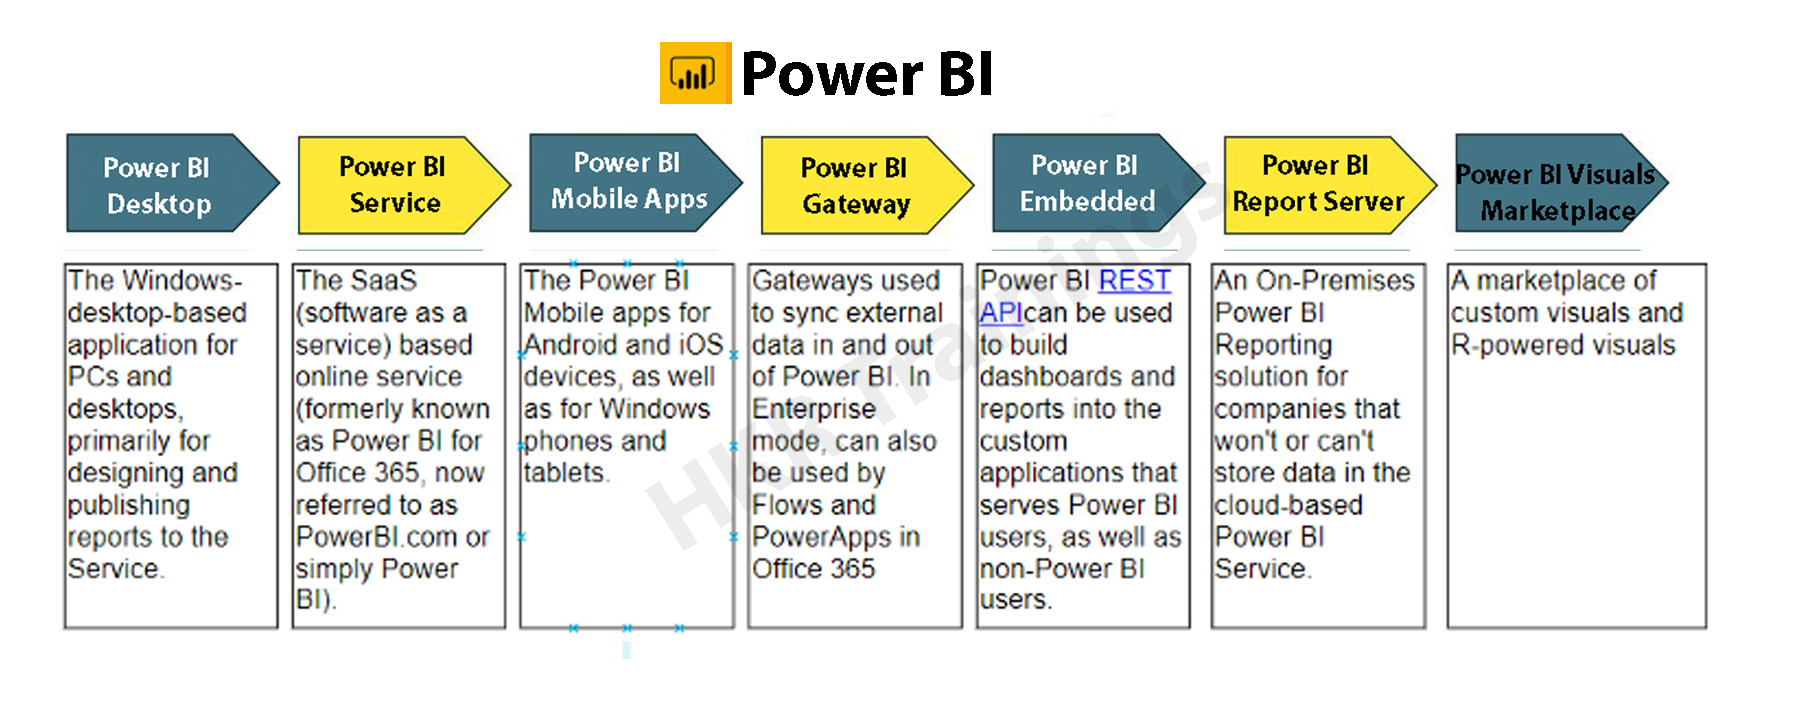
The Benefits of Power BI
Power BI has a number of features that set it apart from other analytical tools:
- It has both a cloud-based and a desktop interface.
- Data warehousing, analytic tools, and interactive dashboards are some of the features available.
- Customized visualizations can be loaded.
- It's simple to scale throughout the entire company.
Become a Sisense Certified professional by learning this HKR Sisense Training
What is SQL Server?
SQL (Structured Query Language) is a crucial skill in the field of data science, and it's quite simple to master. Most people, however, overlook the fact that SQL is more than just generating queries, but that's only the first step. It's a different matter to ensure that inquiries are efficient or even that they match the environment in which you're working.
Microsoft's SQL Server is a relational database management system (RDBMS). It was created largely to compete with the MySQL and Oracle databases. The standard SQL language is supported by SQL Server. T-SQL, SQL Server's own version of a SQL language, is included (Transact-SQL). T-SQL stands for Transact-SQL, a Microsoft proprietary language. It also has the ability to declare variables, handle exceptions, and run stored procedures, among other things. Another important interface tool for SQL Server is SQL Server Management Studio (SSMS), which works in both 32-bit and 64-bit settings.
SQL Server helps to run several services at the same time, each with its own ports, logins, databases, and so on. These are separated into two categories:
- Primary Instance.
- Instances with a Name
There are two methods for gaining access to the primary instance. We can start with the server name. We can also utilize its IP address. By attaching a backslash and the instance name, you can access named instances.
Is SQL important for Power BI?
Power BI Desktop's ability to conduct T-SQL queries gives you useful resources for retrieving SQL Server data. Perhaps you'll be able to get the most out of the SQL Server query engine, and you'll also be able to reduce the amount of the datasets are imported into Power BI Desktop and the number of modifications you have to do.
To take this technique, you'll need to know how to utilize T-SQL, and if you do or can find someone who does, you'll have a lot of flexibility when dealing with SQL Server data. Even if you extract data table by table, you still have a variety of powerful tools for interacting with SQL Server data & organizing it for use in Power BI visualizations. Whereas the Power BI service allows you to retrieve data from a variety of sources, it will not have a SQL Server data connector. One could export SQL Server files and then import them into the service, but you can't connect immediately from service to SQL Server, regardless of the fact that SQL Server seems to play a crucial role in many organizations today. The more you know about importing and transforming SQL Server data in Power BI Desktop, the better.
Prerequisites to connect Power BI To SQL Server
- Before you begin, join up for the free trial of Power BI, in case you do not even already have one.
- On the local computer, install the Power BI Desktop.
- Download SQL Server within a local computer and recover a backup of the demo database.
- In the local computer as SQL Server, install the data gateway.
- Consult a network administrator in the organization if you aren't a network administrator and wouldn't want to set up a gateway yourself. They'll be capable of creating the data source configuration needed to link your dataset to the SQL Server database. Import Data connectivity mode must be used if you're going to employ a saved procedure.
Step by Step approach to Connect Power BI to SQL Server
1. Power BI Desktop and installation
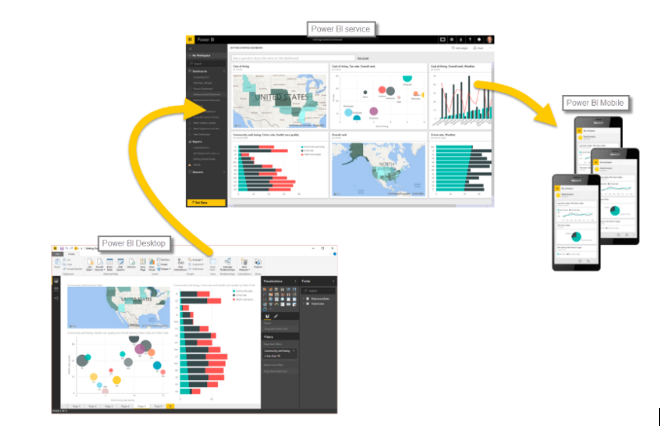
Power BI Desktop seems to be a free tool that you can download and install on your computer. It may link to a variety of data sources. Normally, an analytical project starts with report development in Power BI Desktop. The data is subsequently uploaded to the Power BI service, where it may be associated with the Power BI Mobile applications, allowing users to access the reports on their mobile devices.
Installation
Power BI is only available on Windows computers. Users on Macs may either create a Windows VM on Azure and install Power BI there, including using Turbo.net, that could broadcast Power BI instantly towards the Mac from either the cloud.
There are two ways to use Power BI:
- We can download this from the Microsoft Store as an application and simply login in and get going. This would be the device's digital equivalent.
- We often have to operate with the information in offline mode. In these kinds of cases, download the software first rather than install it locally. Take the time to read through the entire installation guide.
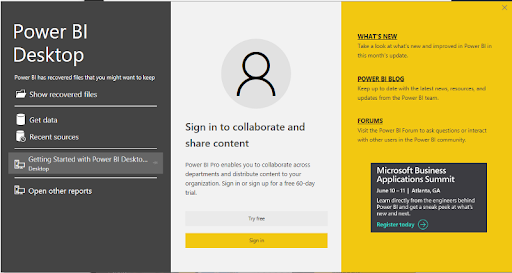
Download the application to the system, based on the products you've chosen. Check the installation via selecting the Power BI Symbol after approving the license agreement. If the screen below shows, you're ready to begin.
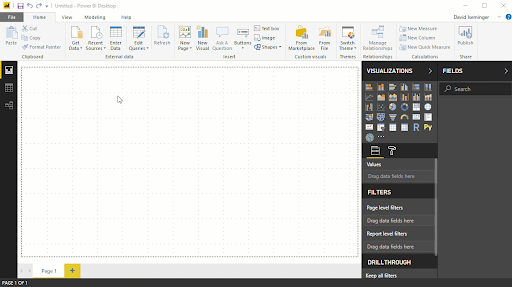
2. Workspace
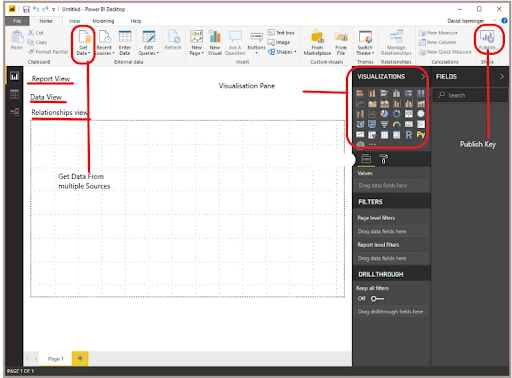
Let's have a look at how Power BI Desktop works now. We'll have a look at it in another part to get an idea of how it works.
The graphic below depicts the key characteristics of Power BI's workspace..
Click here to learn Power BI Tutorial

Power BI Training
- Master Your Craft
- Lifetime LMS & Faculty Access
- 24/7 online expert support
- Real-world & Project Based Learning
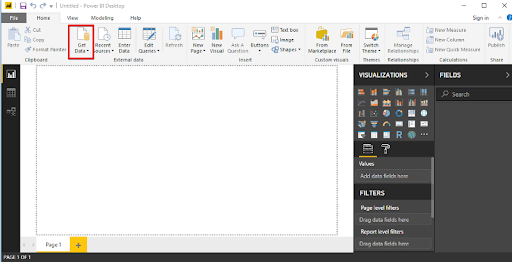
3. Data Source
A variety of data sources could be connected to Power BI. The Get Data button toggles all of the data sources that may be used to import data into Power BI.
4. Connecting to SQL Server
Let's look at an example of connecting a SQL server dataset to Power BI Desktop and using that to examine the data.
Database Example
We'll have to use a publically available SQL Server installation on AWS for the demonstration, as well as a database built from the Superstore dataset.
Our goal as Data Analysts would be to assess the data and identify significant areas of concern inside this hypothetical firm.
Getting into the sample database
SQL Server Management Studio should be installed (SSMS). SSMS seems to be a free and fully integrated management environment for every SQL system. SSMS allows you to install, manage, and modify the data-tier components that your applications rely on, and also create inquiries and workflows.
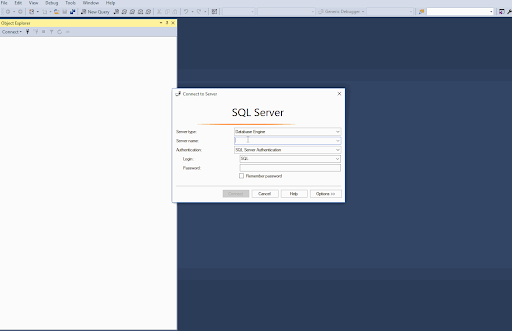
After you've downloaded and installed the software, you'll see the page below, which will prompt you for particular credentials.
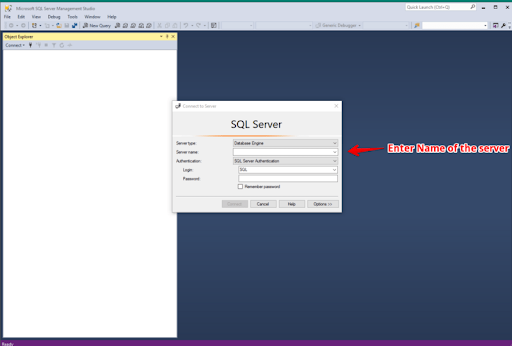
1. Insert the given information:
Server Name: ec2-52-14-205-70.us-east-2.compute.amazonaws.com
Authentication: SQL Server Authentication
Login: SQL
Password: SQL
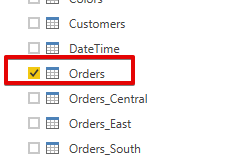
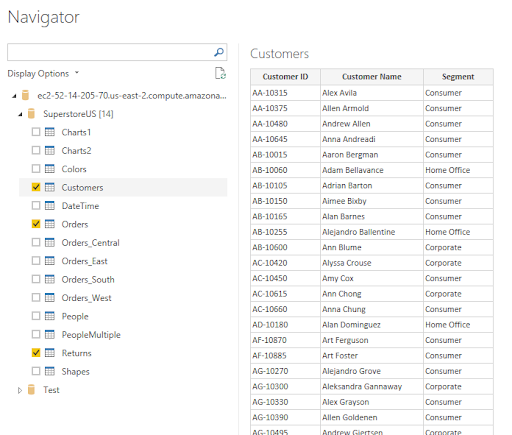
The 'SuperStoreUS' database will indeed be accessible as a 'Read Only' user. As our sample, the instance is ec2–52–14–205–70.us-east
2. compute.amazonaws.com, the databases are SuperstoreUS and Test, and the tables inside the SuperstoreUS database are Customers, Orders, and so on. As a result, there could be lots of instances, each of which can have multiple databases, each of which would contain various tables.
5. Importing SQL data into Power BI
The data is organized into searches by Power BI Desktop. It implies that all of the information is organized in a table-like format.
Making the connection
Proceed to the start button by opening Power BI Desktop. The Get Data tab pane gives you a number of options when it comes to sources of data that could be linked to the Power BI Desktop. We'll establish a connection to the SQL Server.

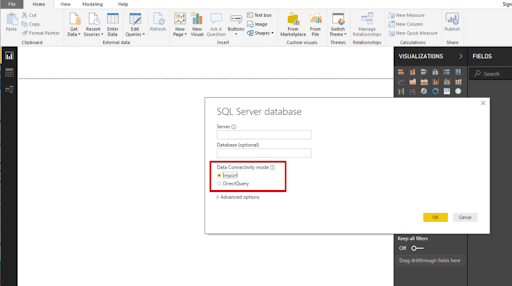
When you select SQL Server, a fresh screen will appear, asking again for the server with which we wish to connect our Power BI Desktop. Fill in the blanks, and you're finished. We could now inspect the details of the selected table by clicking on it. For uploading a certain table, merely check the box beside it click the load button.
Modes of Data Connectivity
Power BI Desktop may link to a SQL database in two distinct ways, both of which display on the homepage.
Import
The import technique, as the title suggests, 'imports' the chosen tables onto Power BI Desktop. The imported data is therefore used by Power BI to create a visualisation or perform any adjustments. We must reload the data to view any modifications in the data, which re-imports the full data set.
DirectQuery
No information is incorporated or transferred to Power BI Desktop if DirectQuery is selected as an option. Power BI Desktop searches the fundamental data source while we generate or process the information through visualisations, ensuring that we're still dealing with the most recent data. Nevertheless, unlike the importing method, this approach has restricted data processing capabilities.
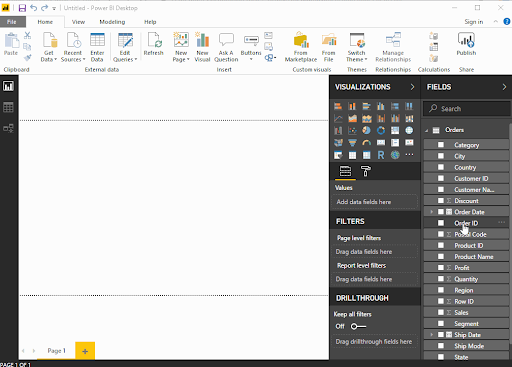
6. Query Editor
All of the chosen tables would be imported into Power BI Desktop & displayed in the Data view as distinct datasets. .
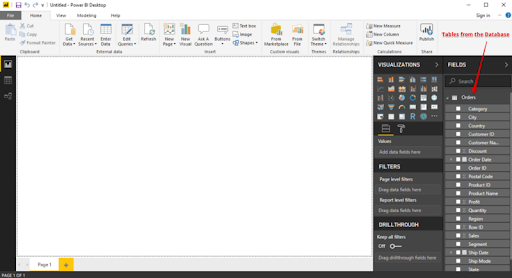
We can make changes to our datasets from here. We'll use the Query Editor to accomplish this. The query generator could be used to edit datasets regardless of the data source. The query editor allows us to perform operations such as rebranding a dataset, eliminating a single or several columns, and so on.
The number of functional inquiries is displayed on the left pane, while the Query Settings pane on the right provides all of the stages related with a query.
Advanced Editor
The script for the inquiry that has been run against the source of data is displayed in the Advanced Editor. The syntax is M, which stands for Power Query Formula Language. It is also possible to write your own code.
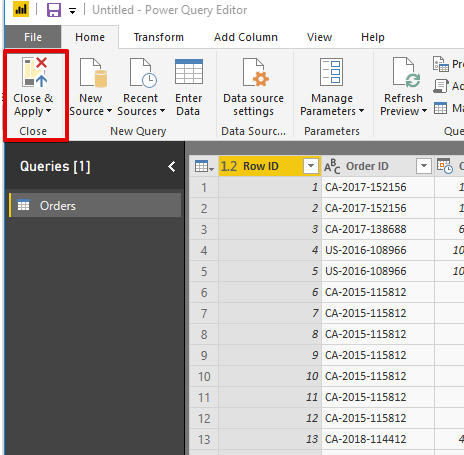
Make a backup of your work
Choose Close & Apply from the Query Editor's File menu once you've made the appropriate data changes in the query editor. The adjustments will be applied to the data in Power BI Desktop.
Top 50 frequently asked Power BI Interview Questions !
Subscribe to our YouTube channel to get new updates..!
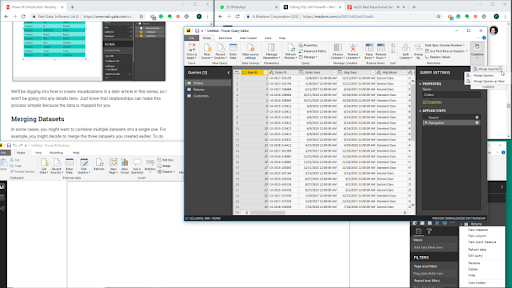
7. Merging Datasets
When we wish to integrate one or maybe more datasets into one, merging datasets proves useful. The Query Editor can also assist with this merger. We'll pull multiple tables(3) from the SuperstoreUS database this time. Customers, Orders, and Returns are the three tables.
The three specified tables are listed in the Fields column. Now, go to the Edit Queries option and click the Combine option from the dropdown menu, which will reveal the Merge option. We'll use the merged existing queries to construct a new query.
We pick the tables to be combined as well as the kind of join we need in the Merge dialogue box. Columns that are similar to both tables must be chosen.
Let's start by creating a new query called Orders and Customers. Through this query, we'll join the Orders and Customers tables. All of the key columns from the orders table, as well as correlation columns from either the customer's table, were included in the new query. Except for the last one, which reflects the Customers query, eliminate all the correlation columns. Next, from the Customers query, choose columns to merge into the newly merged query.
The merged query is composed of a single database that has all of the required columns. Rather than operating with several data sources, which might cause confusion, you could now easily interact with one single database.
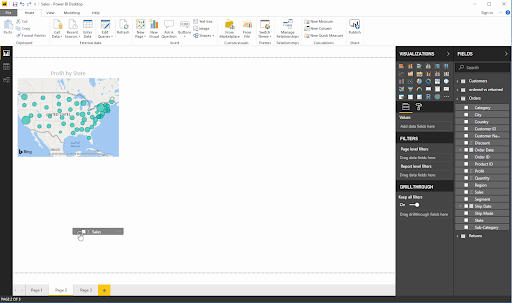
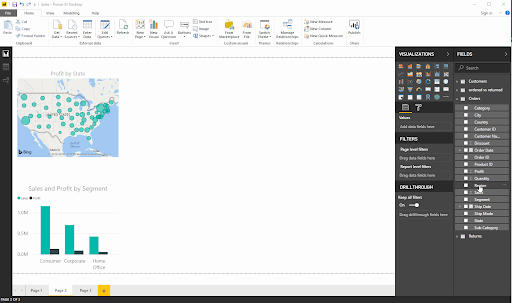
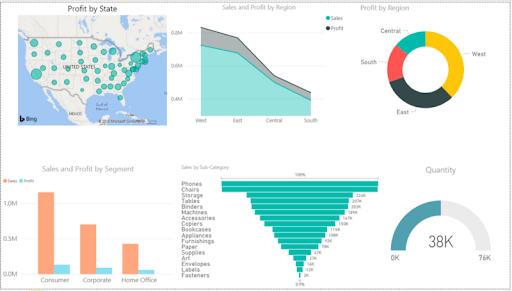
8. Building & Publishing a Dashboard
We may begin the Dashboard construction process since we had the dataset prepared along with all the alterations completed. The Power BI dashboard often referred to as a canvas, is a single sheet that contains multiple visualizations that serve to convey a narrative. The reports' visuals, known as tiles, are attached to the dashboard.
Now just to see what recommendations we can glean from the superstore data set.
- States seeking profit
- Profit & Sales by Segment
-
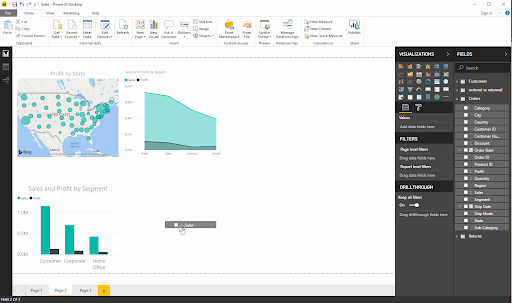
Region-by-Region Sales and Profit
-
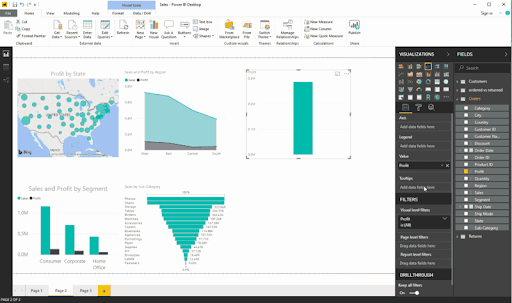
Sub-Category Sales
-
Profits by location
-
Quantity
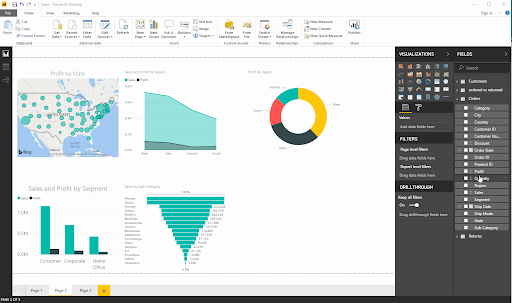
We'll obtain a dashboard that looks like the one below after we've formatted the size, look, and colour.
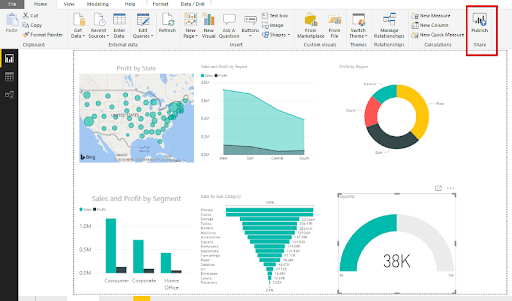
Publishing
Data would be only valuable if it can be transferred across individuals or groups. By publishing the Dashboard or reports to the Power BI Service, they can be shared with others. The Dashboards/Reports can then be seen or interacted with using the Power BI Apps.
Conclusion:
When SQL and Power BI are combined, data analysis is carried out properly. We can integrate SQL Server to Power BI with ease and retrieve information right into it. Customers can switch connections with a single click in Power BI to execute in-memory searches to a bigger dataset. SQL is a handy tool that, when combined with Power BI's expertise, may assist in monitoring and reporting more effectively and informative.
Related Articles:
About Author
Upcoming Power BI Training Online classes
| Batch starts on 31st Jul 2026 |
|
||
| Batch starts on 4th Aug 2026 |
|
||
| Batch starts on 8th Aug 2026 |
|