
JMeter Performance Testing
Last updated on Jan 19, 2024

What is performance testing?
It is critical to ensure that the product performs as expected or required. Unfortunately, we discover this flaw after the product has been delivered. However, performance has become an unavoidable factor in today's world, particularly for web and mobile applications, where user strength is extremely high for each application.
Performance testing is the type of software testing used to make sure that software applications will perform well under expected workloads. It focuses on specific aspects of a software program, such as:
- Speed – It determines whether the application's response time is fast.
- The maximum user load is determined by scalability.
- Stability – It determines whether or not the application is stable under varying loads.
Now we will discover some of the best tools for performance testing
Become a master of Jmeter by going through this HKR JMeter Online Training
Tools used by the Performance Testing:
In real time, performance testing is critical, especially in terms of customer satisfaction. There are a variety of performance testing tools available, including:
- LoadRunner
- Apache JMeter
- WebLOAD
- LoadUI
- LoadView
- NeoLoad
JMeter is a popular tool for performing performance tests. So, let's get started with our "JMeter performance testing tutorial" to learn more about the testing tool.
Jmeter load testing:
JMeter Load Testing is a testing procedure that employs the Apache JMeter load testing tool, which is an open source computer program based on Java. JMeter for load testing is a critical tool for determining whether or not the web application under test can withstand high load demands. It also aids in the analysis of the overall domain controller under heavy load.
Jmeter Performance testing:
JMeter Performance Testing is the process of performance testing of a web application that employs Apache JMeter. JMeter for performance monitoring allows you to test both static or dynamic assets, discover simultaneous connections on your website, and perform a wide variety of graphical analyses. The JMeter performance test involves web application load and stress tests.

Jmeter Training
- Master Your Craft
- Lifetime LMS & Faculty Access
- 24/7 online expert support
- Real-world & Project Based Learning
Advantages of Jmeter:
The open source software Apache JMeter fills a significant void by making testing simple. JMeter has several advantages, including:
- JMeter is free and open source software. It implies it is available for free download. It is also a completely Java application. The developer can use the source code and modify and customize it to meet their needs.
- User-friendly – JMeter seems to have a thorough GUI that aids in the creation of test plans and the configuration of the elements. It is also simple to add elements. Simply right-click on the tree scenario and enter what you need to do.
- Support – It is primarily intended for performance testing, but it also facilitates non-functional tests like Stress Testing, Distributed Testing, Web Service Testing, and so on by creating test plans.
- Comprehensive documentation was among the most crucial details to emphasize. Because of its thorough documentation, users can understand each and every step, beginning with installation and configuration of the test settings and ending with the generation of the final report.
- Recording – JMeter's Recording feature allows users to record HTTP/HTTPS traffic in order to create test plans. We use a Proxy Server, which allows JMeter to monitor and record your actions as you navigate through your web application with your regular browser.
- Reporting – JMeter supports the creation of dashboard reports. JMeter generates a plethora of reports that assist the user in comprehending the results of Performance test execution.
Jmeter performance testing includes the following things. They are: Load test and stress test.
- Load Testing: Attempting to recreate multiple users accessing the Web services concurrently to model the expected usage.
- Testing for Stress: Every web server has a maximum load capacity. When the load exceeds the limit, the web server begins to respond slowly and produces errors. The goal of the Stress Testing is to determine the maximum load that the web server can withstand.
We have the perfect professional JMeter Tutorial for you. Enroll now!
Creating the performance testing plan using the Jmeter:
Before we can test the performance of the target web application, we must first determine-
- Normal Load: The average number of visitors to your website.
- Heavy Traffic: Your website receives a large number of visitors.
- What is your goal for this test?
Here is the process on how one can go through the plan of jmeter performance testing.
- Add thread group
- Adding jmeter elements
- Adding graph result
- Running test and get result
Step1: Adding the thread group:
Just follow the below points to add the thread group. They are:
- Start jmeter
- Then select the test plan on jmeter
- Next you need to add the thread group as shown in the below image.
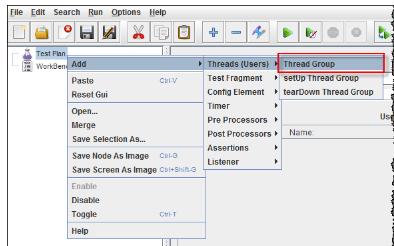
In the thread group section you need to fill the thread group properties such as name of the thread, ramp up period and loop count.here the thread count and loop count are totally different.
JMeter's Ramp-Up Period specifies how long to wait prior to actually beginning the next user. For instance, when we have 100 users and just a Ramp-Up period of 100 seconds, the postponement among initiating customers would've been 1 second.
Step2: Adding Jmeter Elements:
In the step one needs to specify what are the jmeter elements used in this test. The elements are:
- HTTP request default and
- HTTP request
HTTP request default:
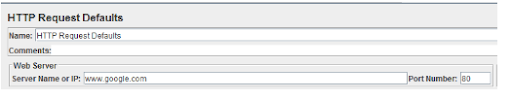
By right-clicking on the Thread Group and selecting Add -> Config Element -> HTTP Request Defaults, you can add this element.

Enter the Website name under test in the HTTP Request Defaults control panel as shown in the below image.
HTTP request:
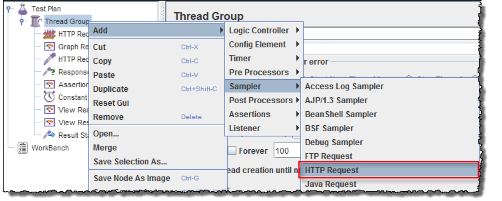
Select Add -> Sampler -> HTTP Request from the menu that appears when you right-click on Thread Group.
The Path field in the HTTP Request Control Panel indicates which URL request you want to send to the Google server.
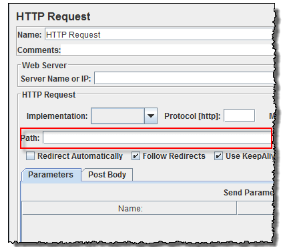
If you leave the Path field empty, JMeter will send the URL http://www.google.com to Google's server.
Subscribe to our YouTube channel to get new updates..!
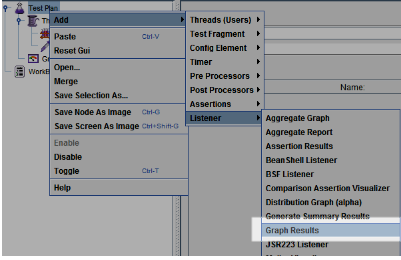
Step3: Adding graph result
JMeter could indeed display test results in graph form.
Right-click Test Plan, then select Add -> Listener -> Graph Results.
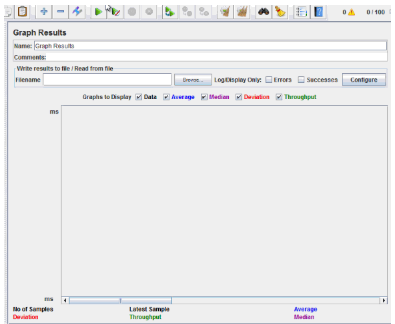
Step4: Run test and get the test result:
To begin the software testing process, click the Run button (Ctrl + R) on the Toolbar. The test results will be displayed on the graph in real time.
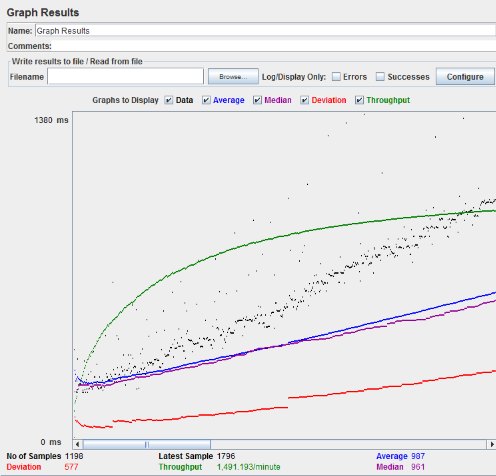
The graph below depicts a test plan in which we simulated 100 users accessing the website www.google.com.
The following statistics are depicted in color at the bottom of the image:
- The total number of current samples sent is shown in black.
- The current average of all samples sent is shown in blue.
- The current standard deviation is shown in red.
- Green: Throughput rate, which represents the number of requests per minute handled by the server.
Let's take a look at the Google server's performance in the graph below.
You should concentrate on two parameters when analyzing the performance of the network server under test.
Throughput \sDeviation
The most essential factor is throughput. It denotes the server's ability to manage a high load. The greater the Throughput, the better the effectiveness of the server.
The Google server's throughput in this test is 1,491.193/minute. This means that the Google server could indeed handle 1,491.193 requests per minute. This value is really quite high, so that we can draw the conclusion that the Google server performs well.
The variance can be seen in red; it represents the deviation from the mean. The smaller the size, the better.
[ Related Article: Continuous Integration Training ]
How to perform the troubleshooting?
If you encounter a problem while operating the preceding scenario... carry out the following actions
- Check to see if you are connecting to the internet through a proxy. If this is the case, remove the proxy.
- Launch a new Jmeter instance.
- In Jmeter, open the PerformanceTestPlan.jmx file.
- Click twice on Thread Group -> Graph Outcome
- Run the Test
FREQUENTLY ASKED JMeter INTERVIEW QUESTIONS
Conclusion:
In the above blog post we had covered in depth about the Jmeter performance testing in a detailed way. Had any doubts drop your queries in the comments section to get them clarified.
Other Related Blogs:
About Author
Upcoming Jmeter Training Online classes
| Batch starts on 22nd Jul 2026 |
|
||
| Batch starts on 26th Jul 2026 |
|
||
| Batch starts on 30th Jul 2026 |
|