Introduction to Tableau:
Tableau desktop is a type of business intelligence tool that is also an interactive data visualization software company founded by Christian Chabot, Pat Hanrahan, and Chris Stolte in the year 2003. The company headquarter is located in Mountain View, California, United States. Tableau is a visual analytics solution that allows people to explore and analyze data with simple drag-and-drop operations. The important is that any user can connect to the Tableau desktop and able to perform reporting and analysis and reporting very effectively and accurately. Tableau Desktop is very easy to use as Microsoft Excel so that even non-programmer learns this tool without the knowledge of programming. After all, this is one of the powerful intelligence tools to solve any complex analytical problems. Tableau desktop having its own patent query language called “VIZQL” or (Visualization query language).
Take your career to next level in Tableau with HKR.Join Tableau Training now
Tableau forecasting:
Forecasting is nothing about predicting future values. To perform this type of forecasting Tableau’s business tool uses the model called “Exponential smoothing”. In exponential smoothing, the recent or newer observations are more valuable than the older observations. This type of model helps to capture the seasonal data and extrapolate them to predict the future. The end result of a forecast can also be considered as a field in the visualization data model.
One more important point to be noted here is that Tableau takes a time dimension and a field measure to create a valuable forecast. All the algorithms related to Forecasting are like a simple model of the real-world data generation process (DGP). To achieve a high-quality forecast, a simple DGP pattern should match with the pattern described by the model. Suppose if the quality is low, the precision should measure with confidence bands to measure the precision of an inaccurate estimate.
Take your career to next level in Forescout Admin with HKR. Enroll now to get Forescout Admin Training!

Tableau Certification Training
- Master Your Craft
- Lifetime LMS & Faculty Access
- 24/7 online expert support
- Real-world & Project Based Learning
Overview of Tableau forecasting :
Tableau forecasting consists of eight different models to generate the highest quality forecast values. The smoothing parameters in each model should be optimized before tableau assesses the forecast data quality. The optimization model in Tableau forecasting is global. To work with these models, you should remember initial data values will be selected according to their best practice but not on the basis of optimization. The eight models of Tableau forecasting are available at the OTexts Web site location: When there are no data values in the visualization, the Tableau tool automatically forecasts at the finer granularity and then aggregates the forecast data values. All the models of Tableau should consist of Multiplicative components or aggregate forecasts value with similar bands and also closed equations.
1. Exponential trend and smoothing:
Exponential smoothing value is the first model of the tableau forecasting, and this model iteratively forecasts the future data values of a regular time series. This one is the simplest model, and computes the next level or smoothed the data value from a weighted average of the last correct value and the last level value. This method is exponential due to the value of each level which is influenced by the preceding value to the exponential decreasing value.
Exponential smoothing models with trends and seasonal components are very effective when you want to measure the forecast exhibits trend over the given period of time. The Trend is also known as a tendency to increase or decrease the data value.
2. Seasonality:
Tableau helps to test the seasonal cycle with the given length of the time aggregation of the time series. For example, if you aggregate by month basis, tableau forecast will take 12 months to finish a cycle, if you aggregate it by quarter, then tableau will search for 4 months, and if you aggregate by days, then tableau will search for weekly basis.
Types of tableau forecasting model:
In the forecast dialog box, you will get a chance to choose the tableau model type for the forecasting purpose. Here you will get an Automatic setting as an optimal choice for the most views. If you got with a Custom option, then users need to specify the trend and season of the independent characteristics, or else you have to choose either None, Additive, or Multiplicative.
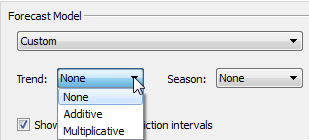
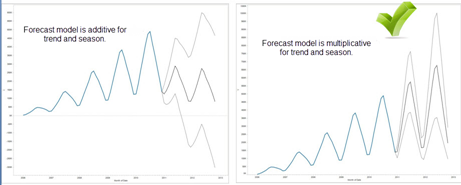
An additive model of the forecast is one where the contributions of the model components are summed, and a multiplicative model is one where at least some component contribution will be multiplied. This type of multiplicative model helps in the significant improvement of forecast quality for data value which is seasonally affected by the magnitude of the data. The following diagram will explain this;
Forecasting with time:
When you start forecasting with a date, then you have to work with the base date in the view. The date can be represented as Rows, Marks, and Columns.
Tableau forecast supports three types of date, they are;
1. Truncated date:
this type of date references the particular points in the specific temporal granularity. These date types are continuous form, with green color in the background view.
2. Date parts:
this type of date refers to the specific temporal measures such as February, and each date will be represented by different discrete fields.
For example:
a. year
b. year + quarter
c. year + week
d. year + quarter + month
3. Exact date:
This type of date refers to the specific point that consists of maximum temporal value. One point to be remembered here that is exact dates are always invalid when you are working with Tableau forecasting.
Creating a forecast in Tableau:
The following are the steps involved to create the forecast in Tableau:
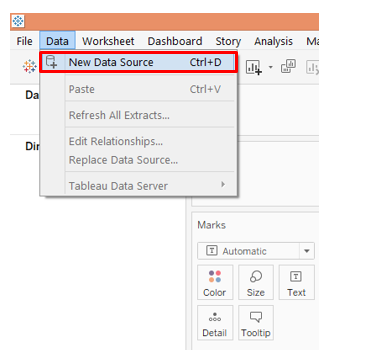
1. First you need to load the data source into the Tableau tool-> then click on the new data source which is under the “data” tab as shown below:
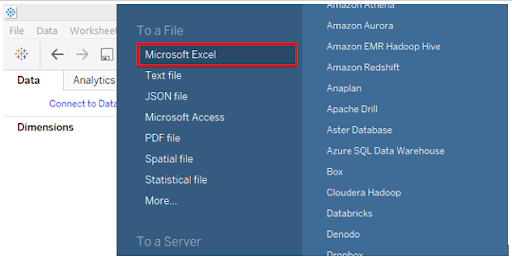
Then click on the required data source type which is shown in the above diagram, for example, Microsoft Excel file -> you need to click on “Micro soft Excel” file.
2. Once you store the data source -> you need to drag the year dimension into the column -> and revenue measure in the row region.
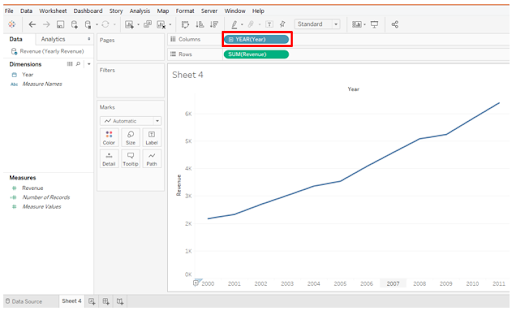
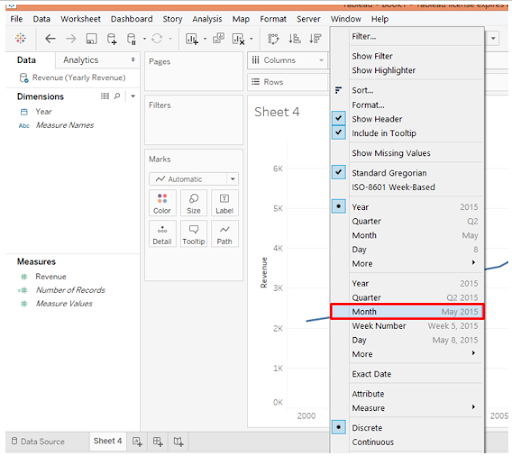
3. Now you want the chart to be displayed on the view -> so to do that you need to select the month function dimension using the drop-down menu as shown below diagram:
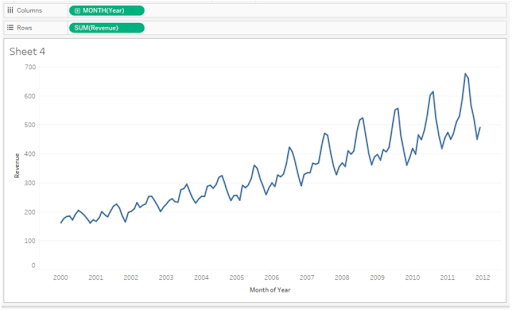
4. Once you choose the month, you need to get a proper line chart, that will display the time series -> this needs to check for the times series -> you can see how it varies in the below screenshot -> seasonable components are available.
If you want to Explore more about Tableau? then read our updated article - Tableau Tutorial

Subscribe to our YouTube channel to get new updates..!
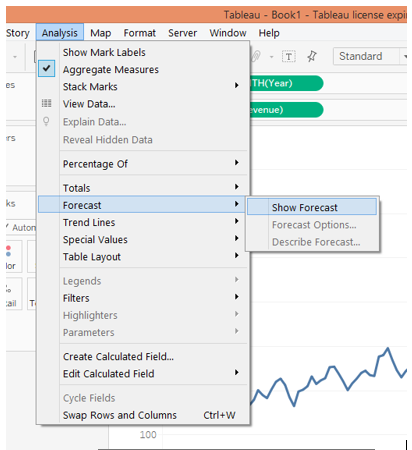
5. TO create the forecast, first go to the analysis menu -> then select forecast option -> then click on the “show forecast” as shown below;
6. Then forecast will be created, on the right side, you can see the forecast indicator. Here you will get two types of indicators they are, Actual and estimate indictors. The actual indicator is a type of point prediction to estimate lower and, whereas the Estimate indicator will be calculated by algorithms based on the confidence interval types.
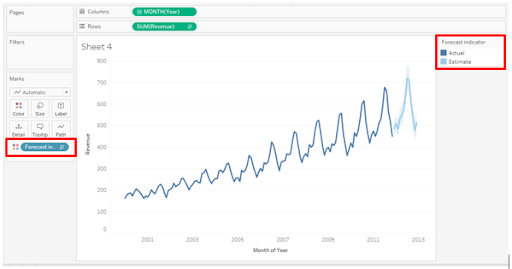
7. So you can see the forecast appears for the next months -> actual forecast represents with the help of dark line, and estimate forecast appears in the form of blue shades around the actual forecast type, the below screenshot will show this;
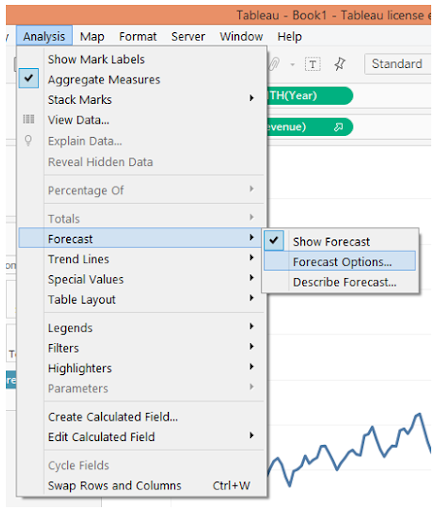
8. Now go to the forecast option -> then click on the forecast option -> next forecast option dialog box will pop up -> there are various sections and options available under this dialog box.
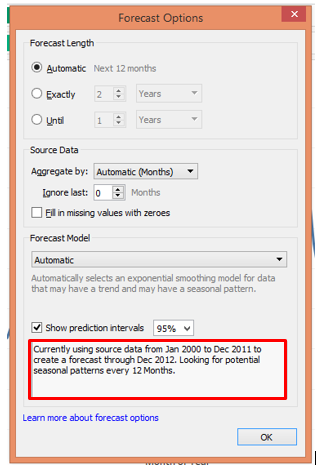
9. From the above screenshot that shows the lights available on the prediction intervals -> this means that we need to determine the algorithm as shown below;
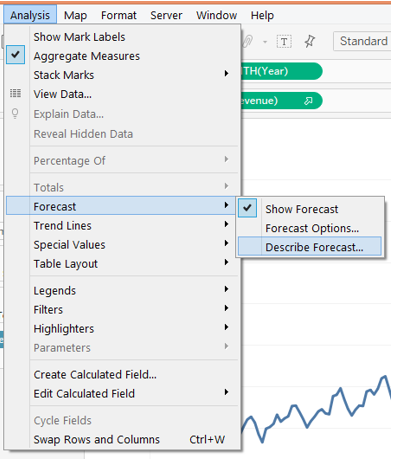
10. Now it’s very important to understand the result -> to do that click on the “Describe forecast” as shown below:
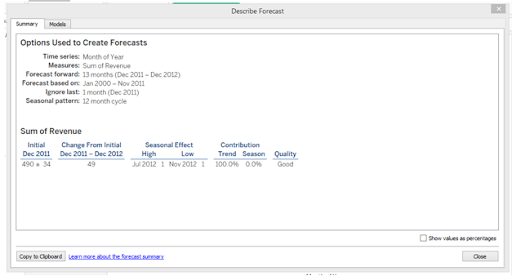
The describe forecast screen is shown below;

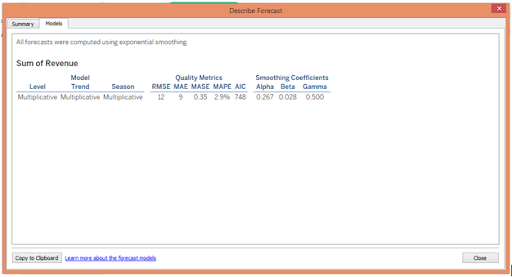
11. Next click on the model tab -> this will take you into various technical components of the given mathematical model.
Click here to get latest Tableau Interview Questions and Answers for 2024
Conclusion:
When it comes to forecasting, time series modeling plays a vital role in predictive analysis. Forecasting doesn’t mean that getting an exact value but it essentially means that obtaining the accurate value. Tableau forecast deals with various result types such as, root mean square error, mean absolute error, mean absolute percentage error, mean absolute squared error, Akaike information criteria, and beta, gamma, and coefficient methods. In this Tableau forecasting blog, we have developed content related to forecasting types, models, and how to create Forecasting in tableau. So I hope this blog may help few of tableau developer who is more interested in predicting future values.
About Author
As a senior Technical Content Writer for HKR Trainings, Gayathri has a good comprehension of the present technical innovations, which incorporates perspectives like Business Intelligence and Analytics. She conveys advanced technical ideas precisely and vividly, as conceivable to the target group, guaranteeing that the content is available to clients. She writes qualitative content in the field of Data Warehousing & ETL, Big Data Analytics, and ERP Tools. Connect me on LinkedIn.
Upcoming Tableau Certification Training Online classes
| Batch starts on 25th Feb 2026 |
|
||
| Batch starts on 1st Mar 2026 |
|
||
| Batch starts on 5th Mar 2026 |
|

