
Tableau Calculations
Last updated on Jan 19, 2024

Tableau Calculations - Table of Content
- Calculations in Tableau
- Why use Calculated fields?
- When we use calculations
- Types of calculations
- Advantages of calculations
- Tableau calculation functions
- Tips and tricks for creating calculations
- Conclusion
Calculations in Tableau
In Tableau, it is essential to understand Table calculations that help to build a strong career in data analytics. Table calculations in Tableau are a type of calculated fields that are calculated on Tableau's local data. These are calculated based on the data in existing visualization. Also, they don't think about any measures or dimensions filtered out of the visualization during the process.
In other words, a table calculation is a transformation we apply to Tableau's data visualization.
For any visualization in Tableau, a virtual table is resolved by the various dimensions in the view. However, this table is not similar to the table that exists in your data source. Significantly, the virtual table is decided or determined by the dimensions within the LOD or the level of detail.
Moreover, Tableau comes with a pre-defined set of calculations you calculate on a visualization. It includes running sum, differences between values, percentage of the sum, etc. Further, the Tableau table calculations provide many benefits that consist of:-
Benefits of Tableau Calculations
- It offers the fastest way to calculate values for tables such as total, percentage, average, etc.
- The table calculation is
- These table calculations are also helpful as calculated fields; we can save them easily.
- It allows advanced calculations in Tableau without knowing the underlying syntax.
- Also, it provides an easy learning curve for the learners.
- Moreover, these are great ways to learn Tableau syntax and various functions.
The following is the format of Tableau's Table calculations worksheet:-
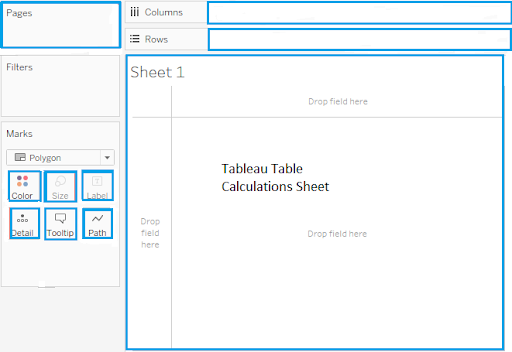
Get more efficient calculated results by computing tableau tables on a small subset of data.
Example of Tableau Table Calculation
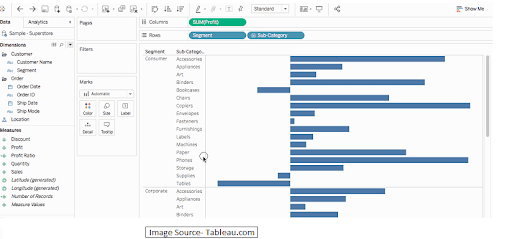
Now, let us see how the actual table calculations work using an example of the supermarket store and calculate the running total.
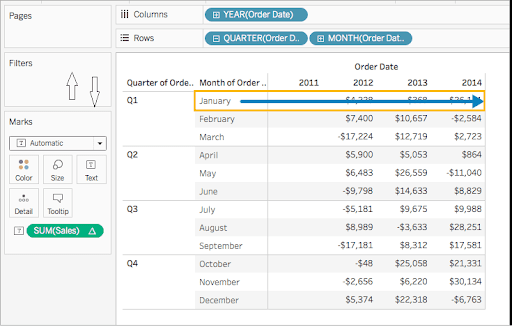
The above image shows that table calculations are added to the measures. Therefore, to add a table calculation in Tableau, click on the action on the visualization. The image you can see shows the running total after applying specific measures.
Using this table, we can quickly analyze the product category and look at the monthly sales for each product throughout the year.
Moreover, to understand the Table Calculations in Tableau, it is important to know that they rely on two different fields. They are - addressing fields and partitioning fields.
- The partitioning fields separate the data into different types and act as a calculation.
- Addressing fields act as a director of the calculation.
Take your career to next level in Tableau with HKR.Join Tableau Training now.
Why use Calculated fields?
Calculated fields are those fields that allow you to build new data from the existing data source. Thus, it is a calculation of new fields for which the values are resolved through a measure that you manage and control. Also, you can use calculated fields with any data type, logical operators, and functions. It helps us to derive many virtual computed results.
The primary purpose of using calculated fields is to execute calculations on the database fields. Also, it helps to build a value that is not stored in the database directly.
Further, there are many reasons to use calculated fields in Tableau, such as:-
- To divide data into new and different ways.
- For the usage of filters that remove unwanted data and help in better data analysis.
- For data aggregation.
- To change or convert the data type of a field.
- To make it easy to calculate various ratios throughout the different Tableau variables.
When we use calculations
Table calculations in Tableau help us in data visualization in many ways. There are many reasons to use Tableau calculations for different purposes. Also, it is important to know while learning Table Calculations when to use them. A few reasons to use table calculations are as follows:-
- To separate or divide data.
- To turn data into a field.
- To filter better results.
- For aggregating data and calculating ratios.
There are some other scenarios also regarding the table calculations in Tableau, such as:-
The data useful for data analysis is missing or lost from the main data source
You can understand this point through an example. Think that you have two fields- Profit & Sales within your data source. But you may want to compute the cost. In this case, you can create a field with the name "Cost" by using the below similar formula-
(Sales) - (Profit)
You can categorize the data much faster.
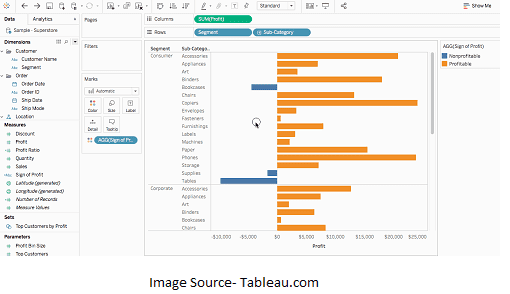
You can set your data category-wise very quickly using Tableau Calculations. Understand this point through the following example. To quickly categorize your visualization data with different colors, you can build a calculated field using a formula similar to the one below and add colors. Here, you can add fields like profitable or non-profitable-
IF SUM ([Profit]) > 0

THEN "It is Profitable"

ELSE "It is Non-Profitable"

END
The above code will help you to understand the categorization of data quickly.
You can change the values of your data visualization chart.
To understand, you can change the values within your data visualization chart in Tableau using the example below. Here, you may wish to compute the difference in business profit from one year to another. Also, you can use the quick table calculation to display the profit differences in the visualization area.
Realted Article, Tableau Competitors !
Types of calculations
There are three different types of tableau calculations that you can use in Tableau to build calculated fields.
- Basic Expressions
- LOD Expressions
- Table Calculations
Basic expressions
In tableau calculations, the basic expressions allow users to change the values at the aggregation or row levels. Here you can take the example of two famous authors and their books. For this, you may wish to build a column with the author's last name and another column that displays their books. Let us know them in detail.
Row Level Calculations
You can use the below row-level calculation to build a column that presents only the author's last name. It will appear for every row in the data source.
SPLIT([Author], '', 2 )
Using this formula, you can present a new column that splits the author's last name while showing the visualization. Also, you can use different colors for each row in the column that presents the row-level calculation.
Aggregate Calculations
The aggregate calculations help create a column that presents the no. of books in each series. The formula you can apply for this type of calculation is-
COUNT ([Series])
Then the new column with the name "Number of Books in a Series" will present the calculation method.
Level of Detail (LOD) expressions
These are similar to basic expressions that allow users to calculate values at both levels- row-level and aggregate. Also, these expressions provide more control to the users to conduct granular-level computations. Moreover, users can execute them at different levels, such as EXCLUDE (the more granular level), INCLUDE (the less granular level), and finally, FIXED (completely independent level).
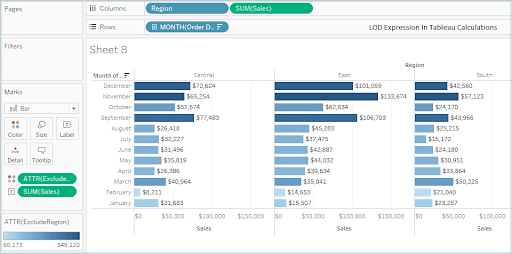
Table calculations
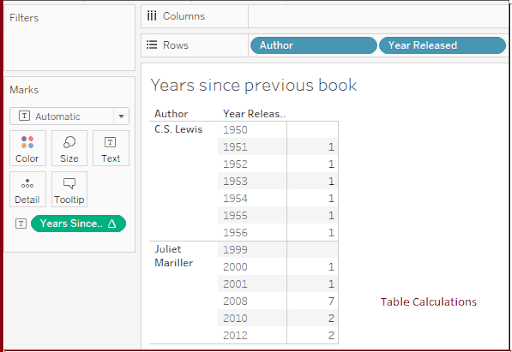
These types of calculations allow users to change values only for aggregation calculations. It means users can alter values only for the visualization level of detail. We are considering the above example if a user wishes to calculate the number of years since the release of the last book by the author. Then he can use the following table calculation-
ATTR([Year Released]) - LOOKUP(ATTR([Year Released]), -1)
A new column will appear here with the name "Years Since Previous Book." It presents the no. of years between the book released in this row and the book released in the earlier row. It also explains the computation of table calculations. In this case, different colors will help you to know about these tableau table calculations.
Moreover, if you alter the visualization that affects the layout, the values of calculations will change automatically. Example: Deleting dimensions from the view.
Advantages of calculations
- Here are the key advantages of using calculations in Tableau.
- Users can create advanced calculations even without having to know the underlying syntax.
- The table calculations can be saved as calculated fields for future use.
- The calculations are performed very faster.
- Users can also learn syntax and functions while working with table calculations.
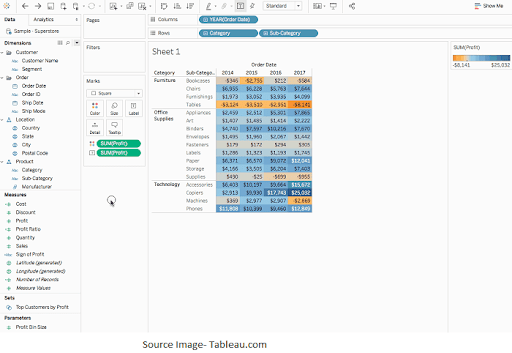
- Tableau provides spotlighting through which users can show discrete thresholds based on the values of a measure. The spotlighted data can be shown in color codes for easy visibility.
- You can directly drag and drop measures into the calculation editor.
Take your career to next level in Tableau with HKR.Join Tableau Advanced Training now.

Tableau Certification Training
- Master Your Craft
- Lifetime LMS & Faculty Access
- 24/7 online expert support
- Real-world & Project Based Learning
Tableau calculation functions
There are different types of Tableau calculation functions available to use. Let us know them in detail:-
Lookup ()
The lookup value returns the selected target's expression values in this Tableau calculation function. Also, it locates the relative offset in the existing row of the table. Further, it will return the NULL value if there is nothing in the target value. The syntax for this function is as follows:-
LOOKUP(expression, [offset])Index()
The Tableau Calculation function index() returns a value from a range of an array. It replaces the existing row index without sorting any value. For example, we can calculate the quarterly sales for a company using the INDEX() to compute the date partition for the index of each row like 1,2,3, etc. Below is an example of using INDEX-
To mention the 4th row of the partition, use INDEX()= 4FIRST()
This function will return the number of rows in the existing row with the first row within the partition. We can take the example of a company's quarterly sales where we compute FIRST() within the date partition; the offset of the 1st row from the 2nd row will be -1. The following example will tell you its use.:-
When the existing row index is 4, then, FIRST() = -3LAST()
The function FIRST() will return the number of rows in the existing row to the last row within the partition. When you calculate LAST() within the date partition, The below example will show the use of the LAST() function:-
When the existing row index is 7 of 10, then LAST() = 8Previous_Value()
This Tableau calculation function returns the calculation values from the previous row. The function also returns the expression when the existing row is the first row within the table. We use the following syntax for this table calculation function:-
Syntax- PREVIOUS_VALUE(expression) RANK()
The function RANK() in the table calculation returns the rank for the existing row of the partition. In the data visualization, we can find each row's rank within the table calculation. Moreover, we can ignore the NULL value within the rank function. The following syntax we can use for the rank function:-
Syntax- RANK(expression, ['asc' | 'desc'])RANK DENSE
This function of the tableau calculation functions returns the dense rank for the existing row of the partition. However, null values can be ignored in this table calculation function. Here, the identical values assign an equal rank, but no gap will insert into the series of numbers. Also, we can use the "asc" and "desc" arguments to specify the ascending or descending order of the rank.
The following syntax is useful here- RANK_DENSE(expression, ['asc' | 'desc'])RANK MODIFIED
This tableau calculation function returns the modified or changed competition rank for the existing row within the partition or table. In this function also, the identical values are allotted an equal rank. Here, we use the following syntax to express the rank-modified function.:-
Syntax- RANK_MODIFIED(expression, ['asc' | 'desc'])Running_Max()
This function returns the maximum value for the given row or expression from the first row of the partition. The following is the syntax we use for the running max function:-
Syntax- RUNNING_MAX(expression)Running_Min()
This function returns the minimum value for the given row or expression from the first row of the partition. The syntax we use for this function-
Syntax- RUNNING_MIN(expression)Running Average
This table calculation function will return the average value of the given row or expression from the first row to the existing row. The following syntax we use here-
Syntax- RUNNING_AVG(expression)Running Count
The function returns the running count of the given row or expression from the first row within the partition. Use the below syntax for the same-
Syntax- RUNNING_COUNT(expression)Running Sum
This function will return the sum of the value for the given row from the first row of the partition.
Syntax- RUNNING_SUM(expression)SIZE
This tableau calculation function returns the number of rows within the partition.
Syntax- SIZE()TOTAL()
This tableau calculation function returns the total for the given row within a table calculation.
Syntax- TOTAL(expression)If you want to Explore more about Tableau? then read our updated article - Tableau Tutorial
Creating a calculated field
Once you choose a calculation, you have to create a calculated field. Open Tableau, select 'Analysis', and click on 'Create Calculated Field'. You will get a calculation editor where you can create your calculation. Give a name for your calculation, enter the formula, and click on 'OK'. You can observe the newly calculated field being added to the 'Measures' section in the Data pane. The calculated field stands out from the rest as it contains a '=' sign next to the data type icon. This calculated field can then be used in creating visualizations.
Subscribe to our YouTube channel to get new updates..!
Tips and tricks for creating calculations
Here are some tips and tricks that can help you while working with calculations. These will help you in creating effective calculations.
- Do not use the same calculated field in multiple calculations. Doing so will result in performance issues.
- Instead of using multiple equality expressions, use a CASE expression.
- Use REGEXP expression instead of using repetition expressions.
- Do not use sets in calculations, but replace them with alternatives.
- Do not group your data with sets.
- Do not convert sets to groups, because they cannot always be translated into groups.
- LOD expressions might rise performance issues sometimes. In that case, try replacing them with a table calculation.
- The data type that you use in the calculation impacts on calculation speed.
- Numeric calculations are much faster than string calculations.
- The ELSEIF works faster than nested ELSE IF in complex logic statements.
- Parameters might affect cache performance.
- All the basic functions pass through the underlying data.
- If you want time stamp level of detail, use NOW. If you want date level calculations, use TODAY.
- When you filter through complex calculations, the indexes might get missed in the underlying data.
- You can drag and drop a part of the calculation from the calculation editor into the Measures section of the Data pane to create a new calculated field.
- While you type in calculations in the calculation editor, Tableau suggests formulas.
- You can browse through the available functions using the functions reference.
- While creating calculations, you can also see which sheets will get affected when you apply the changes.
Click here to get latest Tableau Interview Questions and Answers
Conclusion
The type of calculation that you have to use for your data analysis typically depends on your data, the granularity of the visualization, and the output that you want to get. Ranking, recursion, moving calculations, inter-row calculations can only be performed with table calculations. So, analyze your dataset and your end goal before choosing a calculation type. Tableau also provides a parameter control through which users can determine how a calculation has to perform. Since you are familiar with calculations now, try them out in your visualizations in Tableau.
Related Articles:
About Author
Upcoming Tableau Certification Training Online classes
| Batch starts on 6th Aug 2026 |
|
||
| Batch starts on 10th Aug 2026 |
|
||
| Batch starts on 14th Aug 2026 |
|