
Salesforce Dashboard
Last updated on Jun 12, 2024


- Reviewed by
- Deeksha (Expert in Cloud Computing and Devops)
- What is Salesforce Dashboard?
- Components of Dashboard
- Reports in Salesforce
- Steps in operating a Dashboard
- Best measures to improve Dashboard Performance
- Features of Salesforce Dashboard
- Conclusion
What is Salesforce Dashboard?
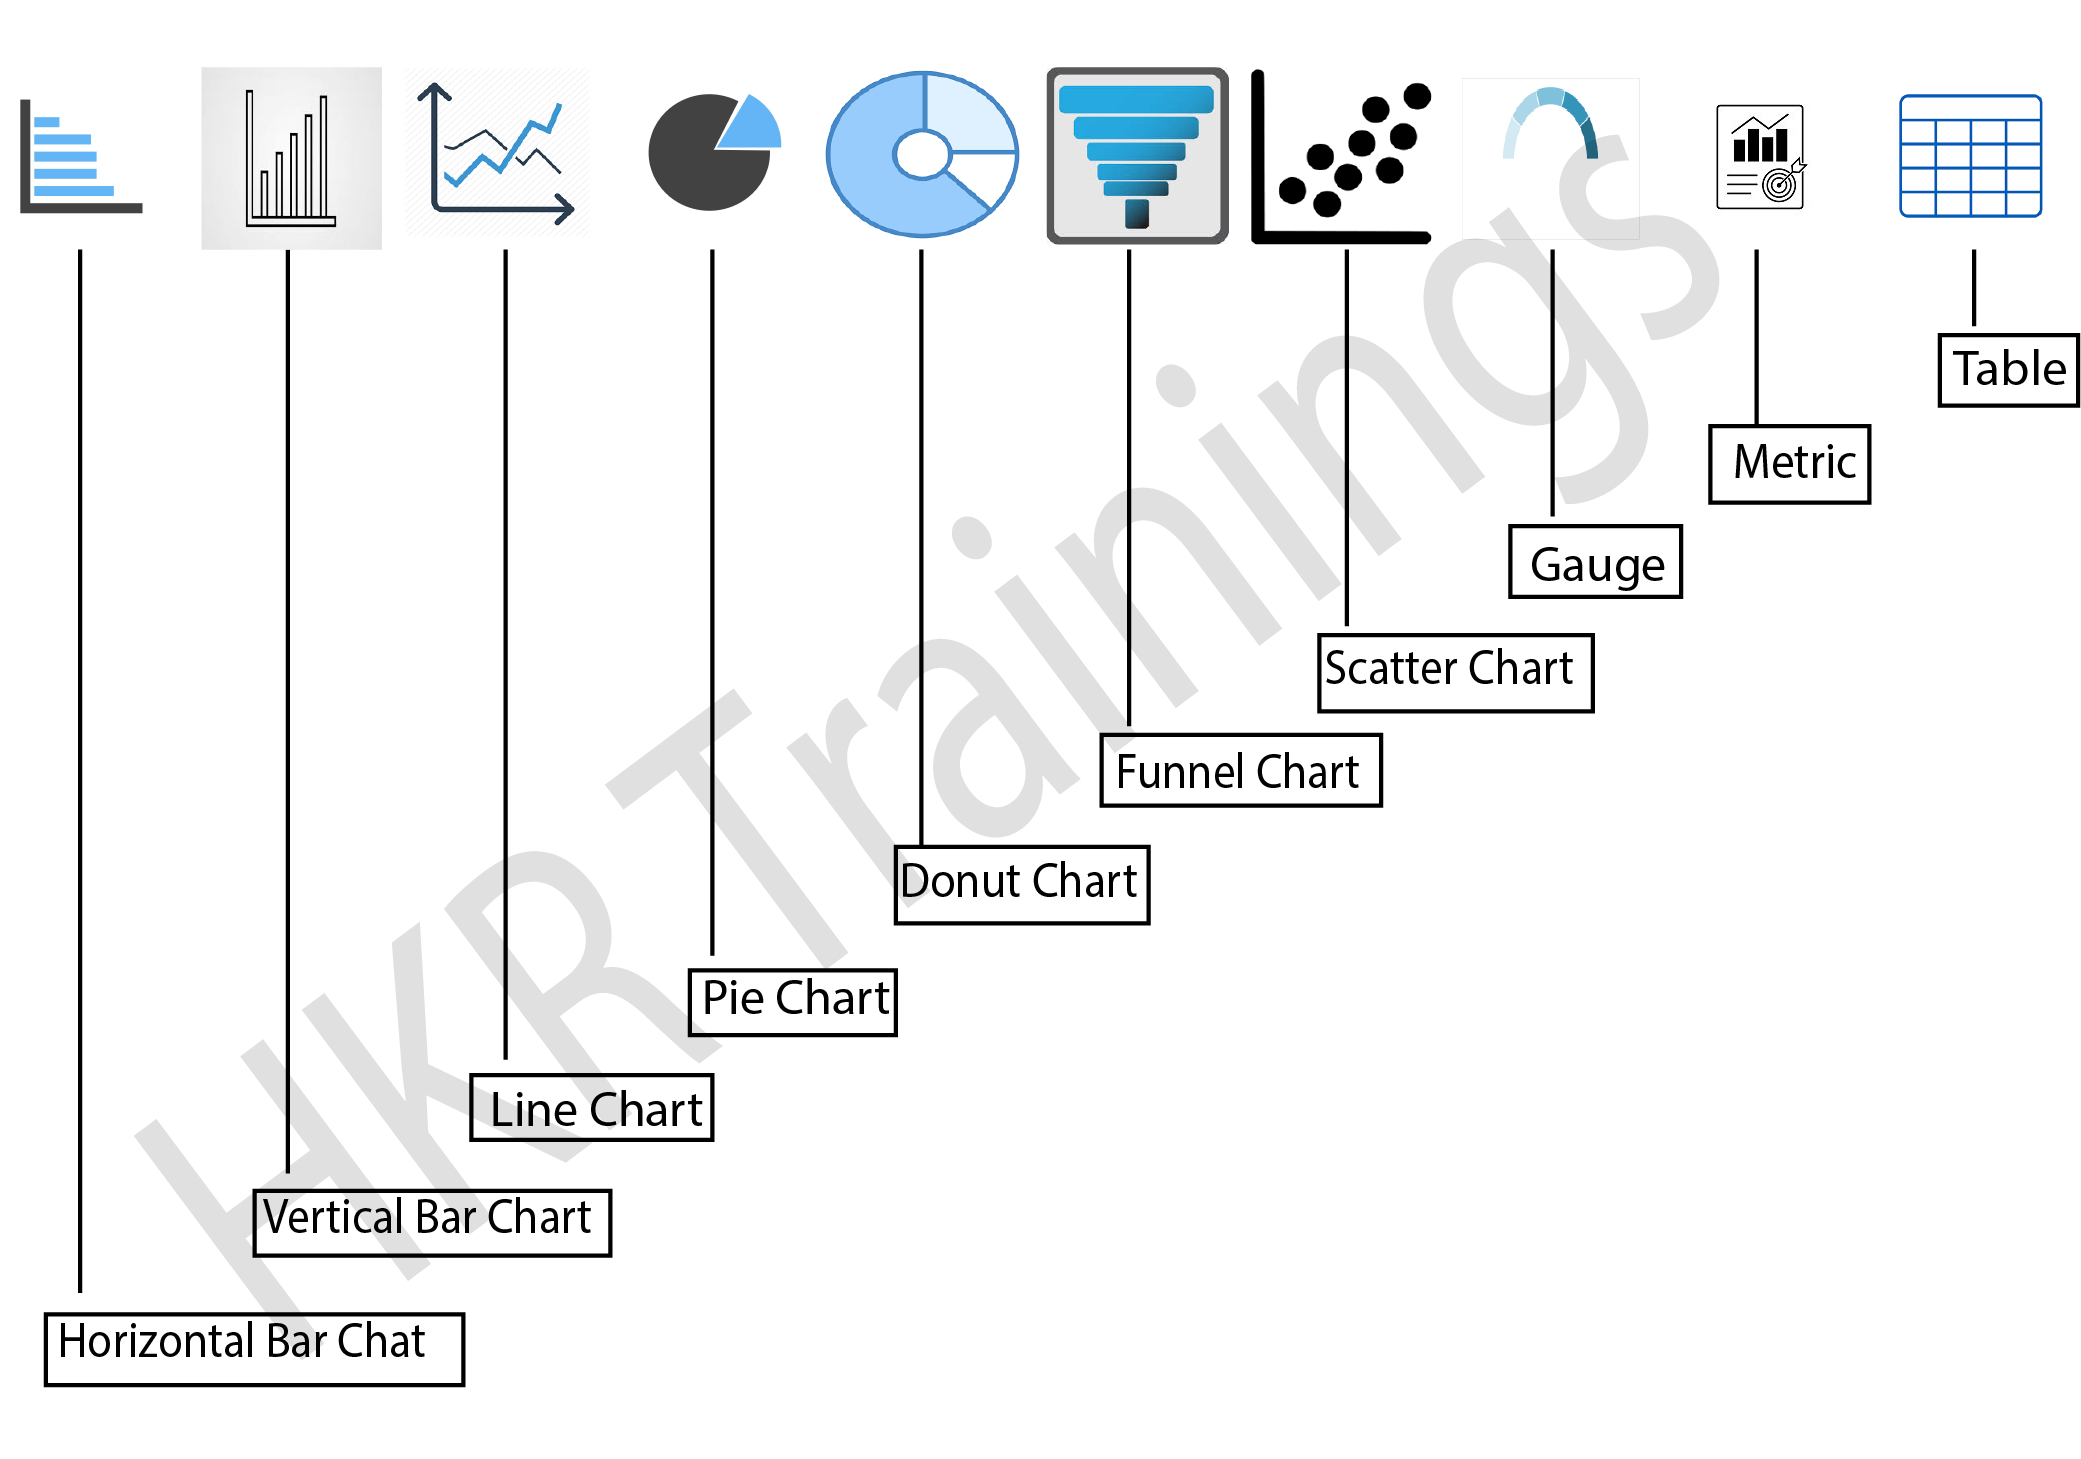
Salesforce dashboards are visual representations of data that can be shown using graphs, bar charts, pie charts, tables, scatter charts, gauges, metrics, funnel charts, and other visual representations. Dashboard components are required to represent Salesforce dashboards.
It is simple to display summary information from several reports at once using a Salesforce dashboard. A dashboard can have up to 20 components. Dashboards can be viewed by anybody who has permission to run reports and access a particular report folder. Dashboards must be refreshed in order to display the most recent data, unlike Salesforce reports.
Components of Dashboard
There are seven types of charts supported by Salesforce dashboards: Horizontal bar chart, Vertical barchart, Line chart, pie chart, donut chart, funnel chart, scatter chart.
Dashboard component visually portrays the information in form of a report. There exists an option to alter from where the segment's information originates from, how the information resembles in the part, and about the sort of segment it is. A dashboard builder can be defined as an interface for developing and adjusting dashboards. There are options to drag, to drop and snap to interchange segments in the dashboard. Float subtleties and other drill-down options are accessible to view and not when we alter a dashboard.
- Creating more number of fields accessible for dashboards through adding it to source report charts.
- Choose the destination folders where the clients end up while picking the dashboard component.
- Ability to customize the table visuals.
- Identify the component varieties like charts, metrics etc.
- Classify the chart types like columns, bars etc.
- Finding the accurate data for the components.
- Finding the accurate visual features for the components.
Wish to make a career in the world of salesforce? Start with HKR'S salesforce online training !
Reports in Salesforce
Reports are used to sum up the data of an article. There are four kinds of reports. They are tabular (shows records simply in a table), matrix (can sum up the data in two dimensional ways), summary (can sum up the data dependent on specific fields), and joined (can sum up data in various blocks on similar items and the connected objects) reports. Five blocks can be made for joined reports. Three groupings can be done for matrix, summary and for join reports. Both summary and matrix reports are used for the dashboard components. 2000 records can be displayed on a page. On the off chance that more records are there for displaying that we can't see those through UI. By trading the records to an excel sheet all records can be send out. Bucket fields in reports are utilized for grouping values to the name we determine in Salesforce. It can gather only the information type fields like texts, numbers and picklists. Salesforce did not uncover any APIs for the reports. For mass deleting the reports by Apex, most ideal way is :
- Shift all reports required to erase in the new envelope.
- Notify everybody that the reports will be erased may be within 30 days.
- Transfer reports envelope in Eclipse along with reports that are to be erased and then erase the reports organizer in eclipse. This will erase all reports immediately.
Steps in operating a Dashboard
1. Constructing a Dashboard
At the point when you're prepared to impart Salesforce information to associates, construct a dashboard. It will allow you to access information from reports utilizing outlines, metrics, tables, and charts. If anyone requires more data, at that point they can see dashboard's information providing reports. In order to create a graphical representation of data the two steps can be followed.

Salesforce Training
- Master Your Craft
- Lifetime LMS & Faculty Access
- 24/7 online expert support
- Real-world & Project Based Learning
a.Constructing a Lightning experience dashboards
Dashboards are created with the source reports, components, and filters. Source reports will be reports that give information to components. Every segment has one source report and is unique. Filters allow dashboard perusers to scope the information they find in the dashboard to a specific sight. Components are called visual blocks present in a dashboard. Every part is either an outline, chart, table or metric.
b.Constructing Salesforce classic dashboards
2. Filtering a Dashboard
Filters make it simple to assure various mixes of information in one dashboard. There is no requirement of discrete dashboards for various groups of clients. While utilizing a filter in the dashboard, the filtered part is demonstrated whenever visiting the dashboard again. There exists a name, up to fifty esteems and a filter operator for each filter. Filter option is available on checkboxes, picklists, queries, text, date, and even date time fields. While changing filters in the dashboard, it shows recently reserved information, if that exists. If there is no information, the dashboard brings the most recent. In any case, The dashboard's last refreshed date gives the timestamp for the information being accessed. Click the refresh option to get the latest information.
The constraints while using dashboard filters is as follows.
- Filters cannot be added to dashboards containing visualforce and s-control elements.
- It's impractical to filter the bucket fields. Notwithstanding, it is conceivable to utilize a report filtered in a bucket field on dashboard pages.
- While scheduling, emailing a dashboard, and on joined report filters are not applied.
- Custom sum up formulas cannot be used.
Subscribe to our YouTube channel to get new updates..!
3. Working with Dashboards
Snap on the dashboard's name to function it. Dashboard graphs are intuitive, so make certain to drift and tap on them to get more information. By reviving dashboard information to share dashboard parts, there are multiple approaches to utilize dashboards. Refresh data in the dashboard. Widen the components in a dashboard to picturize a much larger version in Lightning Experience. Begin the discussion by sharing pictures of dashboard components on Chatter. If you need to find out about the information appearing in a dashboard outline,wee can look at the filtered form of the source reports. Resizing the columns of the table in Lightning Tables.
4. Organizing Dashboards
Keep the dashboards readily available by implanting them on the home tab by Salesforce, printing dashboards, or erasing dashboards which are not required any longer.
The Dynamic Dashboards
In Salesforce, Dynamic Dashboards are made available to some particular users/logged in users. It is used to show information only to a particular user through security settings. Based on the edition of Salesforce, the dynamic dashboards are available. You can find five dynamic dashboards in the enterprise edition while you find ten dynamic dashboards in the unlimited edition.
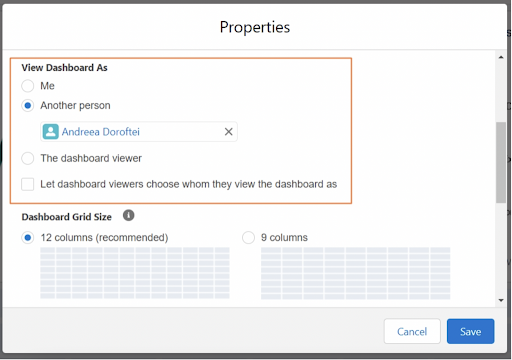
Dynamic Dashboard is an out-of-box functionality in salesforce that enables you to select the user who will run a dashboard; by default, this is the person who created the dashboard, but you may change it at any moment. When a specific object’s sharing model is set to private, this feature will be quite helpful; however Access to the data on specific dashboard widgets is necessary for users who shouldn't otherwise view all the data. Here are the choices an administrator has while making the dashboard "dynamic," as was previously mentioned:
- Another Person: Any active user in salesforce who is permitted to run reports and dashboards counts as another person. Any data to which this user has access will be visible to viewers. This might give them access to information they would not have access to.
- Dashboard Viewer: By selecting this option, the running user will instantly switch to the dashboard viewer. They will only see the information and fields to which they have at least "read access."
Key Information:
- The maximum number of components that can be supported by a dashboard is 20.
- It is possible to use the same report for one or more components.
- Depending on the edition, there can be a maximum of three, five, or ten dynamic dashboards per organisation.
Click here to get frequently asked Salesforce interview questions & answers
Best measures to improve Dashboard Performance
Dashboard refer times can differ depending on accessible assets. Salesforce is based on a multi-occupant structure and dashboard revives are handled in a line. Different elements like reserving can influence dashboard revive times. The dashboard execution relies chiefly upon the exhibition of its source report. Performance degradation can influence the Dashboard execution and its performance. The following measures can be taken to bring out better dashboard performance.
- Utilize effective source reports by making source reports that run quick. The most ideal approach to accelerate a moderate dashboard is to accelerate its source reports by refining report information effectively, eliminating superfluous columns, shroud detailed rows, and composing effective formulas.
- Keep the source reports minimum as possible, mostly on a single report. The less source reports, the less reports need to run for the dashboard to assemble its information. The quickest refreshing dashboards depend on just one source report.
- Refresh dashboards in a timely manner so that processes could give results to up to date information. Salesforce narrows the total number of occasions every client could refresh the dashboard to once every moment. This breaking point guarantees that Salesforce doesn't provide similar reports runs reiteratively, which likewise allow other significant processes to run, such as refreshing cases or producing accounts.
- Eliminate unwanted components in a dashboard by either clubbing different components into a single one or dividing one dashboard into two.
Features of Salesforce Dashboard
- Dashboard Editor
To create new dashboards and change the ones that are already available, users use a visible drag-and-drop tool called Dashboard Editor. This is the place where the dashboard's elements can be arranged, added, and edited. To start a new dashboard choose the "New Dashboard" option.
- Components:
Salesforce Dashboard comprises a number of components. Each component includes a chart or metric that shows data from a specific report. Data from numerous reports may be shown by a number of components or elements.
- End-user:
Users will have varying access privileges to the data in Salesforce. A dashboard displays the data that the user has access to when using the dashboard.
- Filters
Filters enable the dashboard's readers to analyze the data from a specific angle
Conclusion
Salesforce Dashboard is an important feature in Salesforce. Dashboards in Salesforce will enable us to visually represent data. The dashboard provides us with a unique perspective from which to view the data reports. We can perform analysis in the dashboard based on our needs. This analysis will help us improve our business. We will also be able to filter the data using dashboard filters. We hope you found this blog helpful. For more trending blogs on Salesforce you can stay tuned to HKR Trainings. If you have any doubts, you may feel free to post your comment in the comment session. We would revert back to you as soon as possible.
Related Articles:
About Author
Upcoming Salesforce Training Online classes
| Batch starts on 22nd Jul 2026 |
|
||
| Batch starts on 26th Jul 2026 |
|
||
| Batch starts on 30th Jul 2026 |
|