
Looker Dashboard
Last updated on Apr 02, 2024

Looker Dashboard - Table of Content
What is Looker?
Looker is defined as a self-service big data and BI(Business Intelligence) software that helps in solving the problem of SQL in creating data analytics. It plays a very important role in big companies as it tends to help in getting values from the data of the company and giving a complete 360-degree view of it to the customers. It is helpful in industries such as eCommerce, gaming, finTech, medic, AdTech, Saas, etc. The main benefit of Looker is that it helps in providing a unified view of the company, hence each department of the company is satisfied by the needs and is successful in having the desired unified view. It is not difficult to set up a looker as it can be done quickly using some pre-built applications.
We have the perfect professional Looker Training for you. Enroll now!
Looker is compatible working with both web-based data as well as SQL. It is known to support over 25 different applications such as Hive, Vertica, BigQuery, Spark, etc.
The main key features of Looker are stated below:
- Helps in data visualization
- Helps in defining business metrics
- Data modeling languages
- Breaks the barriers to insights
- Optimizes cost
- Enhances performance
- It has embedded analytics
- It has integrations with relational databases
- Formation of reports and KPI dashboards

Looker Training
- Master Your Craft
- Lifetime LMS & Faculty Access
- 24/7 online expert support
- Real-world & Project Based Learning
How does Looker Work?
Looker is basically used for creating SQL queries and then passing them into the database connection. Hence, looker produces the SQL queries which are based on the project called LookML, describing the relationship between the tables and their columns present in the database. Let us understand the working of the looker in the section below:
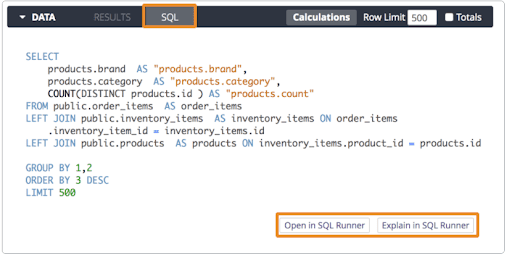
1. Viewing the query:
A user can simply use the SQL tab present in the Looker’s data section and know what all is Looker sending into the database for getting the data. The user can even use the bottom links for viewing the query present in the SQL runner.
Let us refer to the image below for a better understanding:
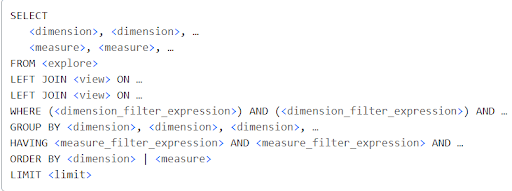
2. The canonical form of a Looker Query:
The dimensions, views, measures, explores and references, etc are all defined in the LookML project. Let us refer to the image below:
3. Running raw SQL in Looker’s SQL Runner:
The Looker consists of a feature called SQL runner that helps in running the SQL against DB connections the user has set up inside the Looker. The raw queries present in the SQL are executed in the SQL Runner producing an identical outcome. The SQL runner also helps in highlighting the errors present in the SQL command along with the position of the error in the message in case the SQL gets any kind of errors.
Looker Blocks
The looker blocks are defined as the pre-built pre-built models of data that are used for accelerating the sources of data and their analytics patterns. These are also called the entry points used for flexible, easy, and quick analytics.
Let us have a look at a few looker blocks and discuss their usage:
Source Blocks: These are the data sources for the analytics, working as a third party.
Analytic Blocks: Helps in various types of analysis of the design patterns
Data Tools: They have multiple data analytic techniques.
Data Blocks: They have public data which is pre-modeled.
Viz Blocks: Represents the output of the query of the type custom visualization
Embedded Blocks: Embeds the data into customized apps
Check out our Latest Tutorial video. Register Now Looker Online Course to Become an expert in Looker.
If you want to Explore more about Looker? then read our updated article - Looker Tutorial
Subscribe to our YouTube channel to get new updates..!
Looker Dashboard
Looker Dashboard is defined as a collection of queries that can be displayed in the form of visualizations on a screen as a dashboard. Looker dashboard helps users in altering filters on the dashboards, setting up the delivery schedules on the dashboard, applying alerts to the tiles and downloading data on the dashboard, etc.
The looker dashboard helps in building a query using the steps below:
1. The name has to be given to the query
2. The field and filters needed to be assigned to the query
3. The visualization options need to be configured
4. Click Run once the query is setup
5. The query is saved as a tile using save on the dashboard.
There are a few things that users can perform using the looker dashboard:
- Viewing the dashboard: It helps in a lot of ways such as changing filter values of the dashboard, pinning the e dashboard, updating data on the dashboard, drilling and exploring data points, viewing the LookML dashboard, legacy dashboard, etc.
- Creating user-defined dashboard: Used for creating dashboard tiles and creation of dashboards.
- Editing user-defined dashboard: The editing part such as re-arranging, editing tiles of the dashboard, settings of the dashboard, deleting the dashboard, etc.
- Adding saved content to the dashboard: It performs features such as editing, configuring, addition, and deleting the dashboard.
- Cross-filtering dashboard: It performs features like cross-filtering, drilling, sharing, etc.
- Scheduling dashboard: It helps in sending a dashboard to the email after scheduling it.
- Comparison of user-defined and LookML dashboard: Understanding various user-defined dashboard features and looker dashboard characteristics.
Usage
The looker’s Usage page is defined as the dashboard-created dashboard for presenting useful information related to the Looker instance. It enables the admins to use their data and understand it better for further utilizing it in the applications. The usage page is found under the Server section in the admin menu.
The i_ _ Looker Model
The information present in the looker model is contained in the i _ _ looker. It helps the user in building custom and useful reports.
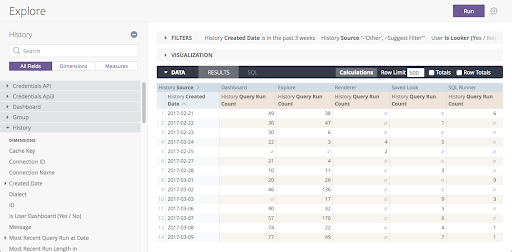
Usage Dashboard
A user can access the usage dashboard using the looker’s Admin page.
The download can be scheduled in the usage dashboard in a similar manner to any other dashboard. The metrics can be drilled along with the elements easily.
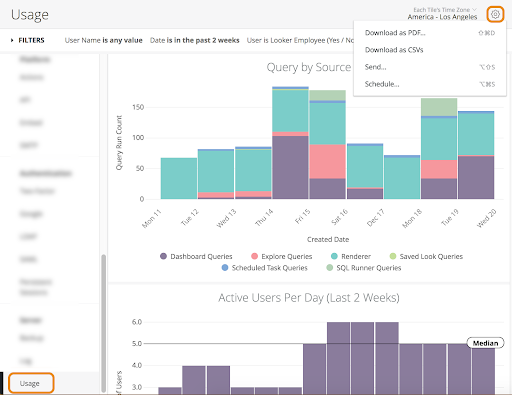
Query by Source Title
The query source title is present at the top of the Usage page and it contains all the information about the queries and the number of queries present in the Looker. The sources for this are mentioned below:
- Dashboard: It has queries related to the tiles.
- Explore: It has a query related to explorer running.
- Renderer: It has a query related to generating images.
- Query: It has a query related to the looker's internal database.
- SQL Runner: The queries are run directly in the SQL
- Saved Look: It contains queries related to looks
- Public Embed: The query can run from the content accessed via a non-private URL.
Check out our New Interview Questions Video. Register Now Looker Online Training to Become an expert in Looker.
Top 30 frequently asked Looker Interview Questions !
Conclusion
Looker is an amazing tool to work with as its features and robustness are great. Looker is defined as a self-service big data and BI (Business Intelligence) software that helps in solving the problem of SQL in creating data analytics. The looker’s dashboard is defined as a collection of queries that can be displayed in the form of visualizations on a screen as a dashboard. In this article, we have discussed more lookers such as its working and its features along with the usage model and i _ _ looker model.
About Author
Upcoming Looker Training Online classes
| Batch starts on 6th Aug 2026 |
|
||
| Batch starts on 10th Aug 2026 |
|
||
| Batch starts on 14th Aug 2026 |
|
FAQ's
Looker Dashboard is defined as a collection of queries that can be displayed in the form of visualizations on a screen as a dashboard
It can be viewed using the 3 dots situated at the top corner of the dashboard.
It is used using the steps below:
1. The name has to be given to the query
2. The field and filters needed to be assigned to the query
3. The visualization options need to be configured
4. Click Run once the query is setup
5. The query is saved as a tile using save on the dashboard.
Looker dashboard helps users in altering filters on the dashboards, setting up the delivery schedules on the dashboard, applying alerts to the tiles and downloading data on the dashboard, etc.
Yes, Looker is a data visualization tool