Tableau Tutorial
Last updated on Jun 12, 2024
- Tableau as the data visualization tool
- Why should we use Tableau?
- Features of Tableau
- 2.Tableau Desktop and Tableau Public Installation
- Downloading and Installing Tableau Public
- 3.Tableau Architecture
- 4. Tableau Environment and Work Space
- 5. Building views in tableau
- 6. Tableau Data Source Connections
- 7. Exporting Database Connection in Tableau
- Adding and editing tables to the data window
- Conclusion
Tableau as the data visualization tool:
Tableau is a popular business intelligence and data visualisation application. It is widely used for creating and delivering highly engaging and efficient reports and dashboards that represent the data in an aesthetically compelling manner including patterns, variations, maps, graphs, plots and so on.
Tableau could relate to a large number of files, relational, and large data files for data collection and processing. The table tool can integrate all forms of data such as hierarchical, unstructured, and broad data sources for data acquisition and processing.
Tableau makes it easy for business professionals to work with practical applications and moreover it serves as the distinct leader in the business intelligence and data visualization platform.
Wish to make a career in the world of Tableau? Then Start with HKR'S Tableau Training Online
Applications of Tableau:
Tableau is the most powerful tool and can be used to work in any industry and any kind of data. Here I am going to help you with some real time applications of a tableau. They are:
- One can easily get through the visualizations of the data and insights of the varied data sources at a glance.
- It works deliberately with trending and forecasting features.
- You can discover the hidden patterns of the data with extreme data discovery options.
- With the help of a tableau dashboard you can easily work interactively and intuitively.
- It helps to connect with the powerful programming languages in rider to perform the table calculations.
- Tableau helps in leveraging the power of the databases and also improves the query performances.
Why should we use Tableau?
Due to this extensive use of this tool by the organizations, there is a shortage for the tableau working professionals. Also the salaries for the professionals are high in the industry. So this tool should be learned by all the professionals. However there are many reasons to learn this tool. They are:
- Data analytics and visualization is necessary for every industry.
- It is highly versatile and can work with any data warehousing and ETL tool.
- There requires no personalized skills to learn the tabelu.
- Tableau supports a big community and is expanding day by day.
Tableau Products Offerings:
The different products of tableau are:
- Tableau desktop
- Tableau server
- Tableau online
- Tableau public
Tableau desktop:
Tableau desktop is one of the data visualization applications that helps in examining the various structured data so as to generate high quality and interactive reports, graphs, dashboards and reports in a minute. If a fast installation is completed, you can connect to practically any data source from word documents to data warehouses and view information from a variety of graphical perspectives. Built to be easy to use, you're going to work better than ever before.
Tableau Server:
It's a business intelligence framework that provides browser-based analytics that anyone can use. It's a quick-fire alternative to the sluggish speed of conventional BI apps. It is an online solution for uploading, sharing and collaborating on content generated in Tableau.
frequently asked Tableau Interview Questions and Answers
Tableau Online:
Tableau Online is a stable, cloud-based solution used for uploading, distributing and interacting with Tableau Views and dashboards. Tableau Online sets the simplicity and ease of a powerful cloud-based data visualisation solution to function for you without servers, application software or IT support. It makes market analysis quick-fire simpler than ever before. Share dashboards with the whole business and with clients and partners in minutes.Focus on providing live, collaborative viewing of data to make it easier for people to answer their own questions, whether on a web browser or a computer. And do this in a stable, hosted environment. Tableau Online will be able to scale as much as you like, and you can use it anywhere you need it. You don't need to buy, set up or maintain any facilities.
Tableau Public:
Tableau Public is a free programme to make it easier for everyone to connect to a spreadsheet or file and to create interactive web-based data visualisations. It is provided as a service that allows the customer to be up and running overnight. Tableau Public users can build and upload awesome immersive visuals easily, without the aid of programmers or IT.It is intended for organisations to promote integrated data visualisation on the websites. There are higher limitations on the quality of the sample you can use. So you can hold your raw data hidden, among other features.
Features of Tableau:
The features of the tableau are:
- It is user friendly and is easy to use.
- There is no need to be proficient with any technology, just some raw data and the tabelu tool is required to pull the attractive reports on the data.
- It comes with a drag and drop feature that helps in providing the reports.
- The VizQL is a visual query language, that helps in translating the drag and drop actions into data queries and then represent the data visually.
In Spite of its exciting features, tableau has come with some strengths and weaknesses.The strengths refers to the benefits of the tableau. They are speed, easy to use, interactive dashboard, easy publishing, sharing and direct database connections. The weaknesses of Tableau are it has no predictive analytical capability, does not support easy customization, integration with other apps, and robust enterprise class security, etc.
2.Tableau Desktop and Tableau Public Installation:
In this section, we are going to learn about how to perform tableau desktop and tableau public installation.
- You need to follow a few steps in order to install the tableau desktop.
- First you need to search for the following link: Tableau Desktop in your browser.
- Open the website and click on the try now button that is displayed on the top right corner of the website.
- It then redirects to a page where you need to enter your details such as email id and then click the download button so as to enjoy the free trial.
- The latest tableau version will start downloading, .exe file will be downloaded and you can see it in the bottom left corner of the website.
- Just click on the downloaded file and click on the accepting terms and conditions and then click install button.
- Then a pop up is shown to the administrator to approve just click on the yes so as to approve the installation.
- Now the tableau desktop is installed successfully and just opens it.
- A registration window will be opened.
- In the registration window click on activate tableau and enter your license credentials
- If you won't have any license credentials simply enter your credentials and click on the start trial now button.
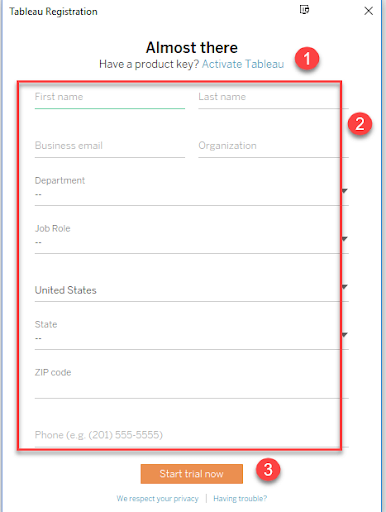
- Wait for the registration to complete and then start trial now. Now you can see the table desktop installed on your windows system.
Downloading and Installing Tableau Public:
Similar to that of installation of the tableau desktop, you need to follow the same steps in order to download and install the tableau public.
- Just go to the link Tableau Public on the browser, enter your email id and then download the tableau public.
- .exe file is downloaded and you need to open it and then click on the accept terms and conditions, next click on the install button.
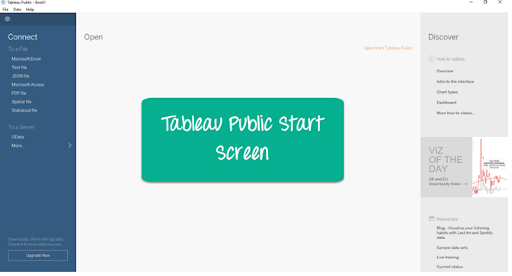
- As tableau public is free immediately after installation start the screen of the tableau as shown in the below image.
3.Tableau Architecture
Tableau Server is created to integrate a variety of data third parties. You can connect your desktop, tablet, and web clients. Tableau Desktop is a powerful data analysis tool. It's highly accessible and stable.
It can be run on both physical and virtual machines. It's a multi-user, multi-process, multi-threaded system. It comes with powerful features that facilitate robust architecture. Now let's go through the tableau server architecture in detail.
Here, we are going to learn about the tableau server architecture, data servers, data connectors, components of tableau server, gateway and clients, etc.
Related Article: Tableau vs Spotfire
Tableau Server Architecture:
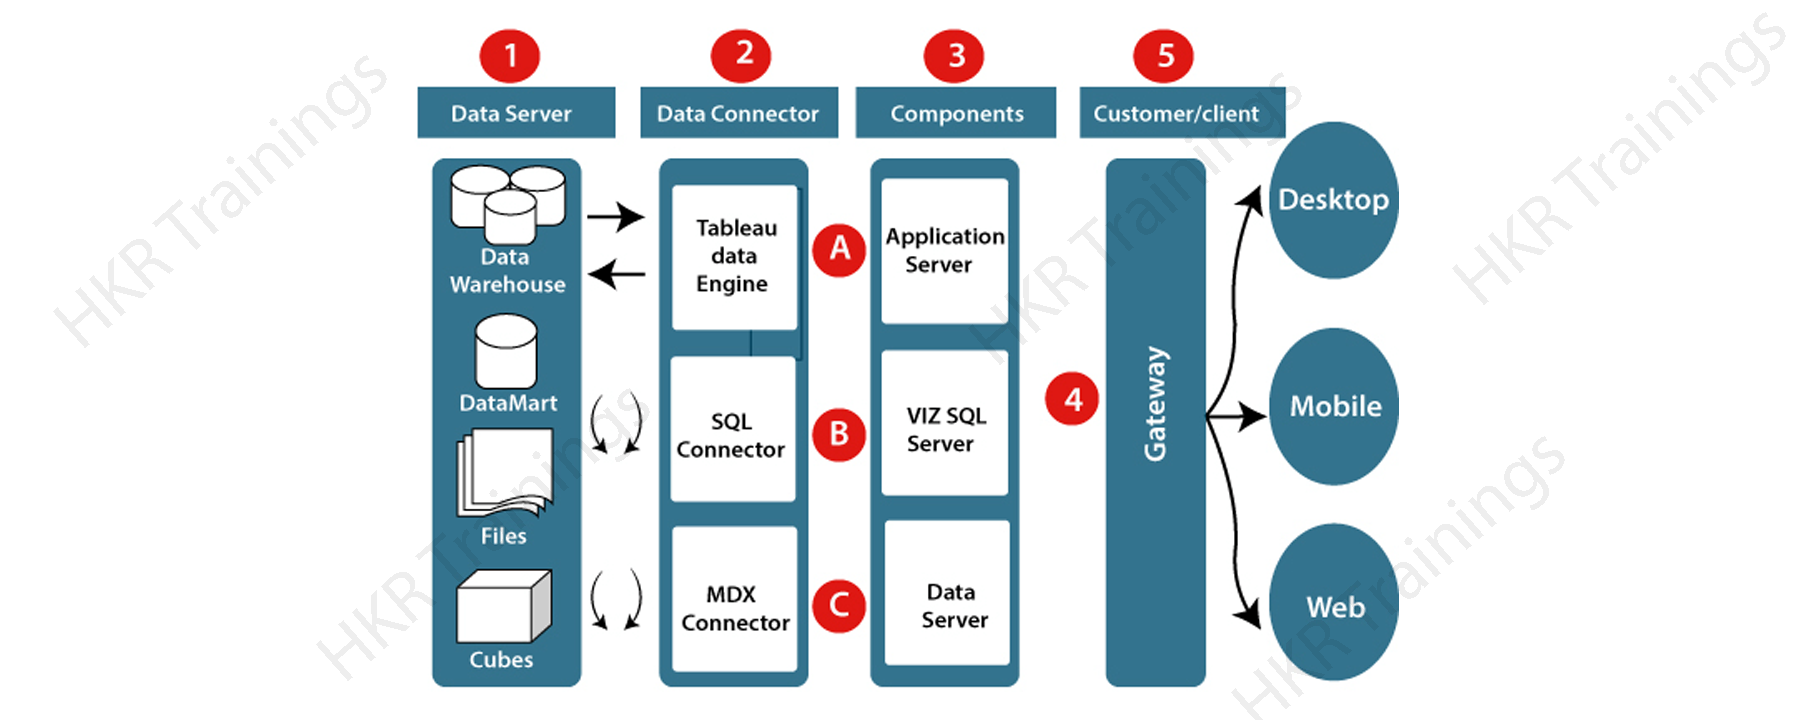
Tableau server provides an integrated clustering, supports high availability and is highly secure. The various layers of the tableau server architecture are:
Data Layer:
The main component of Tableau Architecture is the data source that can be linked to it. Tableau can be linked to several data sources. These data sources can be on-site or remotely located. It can connect to a database, an excel file, and a web application at the same time. Tableau can connect data from heterogeneous environments. Data from various data sources can be blended. It can also create a relationship between different types of data sources.
Data Connectors:
Data Connectors provide an application for connecting external data sources to the Tableau Data Server. Tableau has an ODBC/SQL adapter built-in. This ODBC Connector will connect to any database without using its native connector. Tableau has the ability to pick both live data and extract data. Based on the use, it is simple to switch between extracted and live data.Tableau has the option of collecting data from external data sources. A local copy can be rendered in the form of an array extract format. It can extract millions of records with a single click in the Tableau data engine.Tableau can bind to real-time data simply by connecting to an external database. It uses the current database system infrastructure by submitting dynamic MDX (Multidimensional Expressions) and SQL statements. This function will connect to live data with Tableau instead of importing the data.
Related Article: Tableau Version History
Components of tableau server: The tableau server comprises three different components. They are:
1. Application server: The application server is used to provide authentication and authorizations. It manages the administration and authorization of online and mobile interfaces. Ensures protection by documenting each session id on the Tableau Server. The administrator will configure the default timeout of the session on the server.
2. VizQL server: The VizQL server is often used to translate applications from the data source to visual representations. When the customer order is submitted to the VizQL process, it transfers the request directly to the data source and retrieves the information in the form of an image. This image or visualisation is displayed to the user. Tableau server builds a visualisation cache to reduce the load time. The cache can be shared with several users who have permission to access the visualisation.
3. Data Server: Data servers can be used to manage and store data from external data sources. It's a centralized data warehouse. It usually deals with metadata, data protection, data storage, data link and user requirements. It stores the related data set information, such as metadata, measured fields, sets, classes, and parameters. The data source could retrieve information as well as intention to perform connections to external data sources.
Gateway:
The gateway channelizes user requests to the Tableau components. When the client submits a file, it is transferred to the external load balancing machine for storage. The gateway acts as a system distributor for different components. In case of lack of an external load balancing system, the gateway often acts as a load balancing device. For single server setup, all processes are handled by one primary server or gateway. For multiple server setups, one physical device acts as a main server while the other is used as a worker server. In the Tableau Server environment, only one computer can be used as a primary server.
Clients:
Tableau provides interactive dashboards for clients using zero-footprint HTML and JavaScript (AJAX) in a web browser, or natively through a smartphone app. No plug-ins or helper applications are required. Tableau Server supports the following types such as different web browsers, mobile apps, ipad app, android app and android browser, etc.
4. Tableau Environment and Work Space:
Here we are closely inspecting the working environment of the tabelus i.e openings and closing of an application in the tableau.
Two steps to follow in order to work on the tableau desktop.
- First open the application on your computer, then select the teabalue workbook where you files related to tableau are stored here.
- After you're done with the work just look at the close icon at the top right corner of the application and then click it by saving your data.
Tableau workspace:
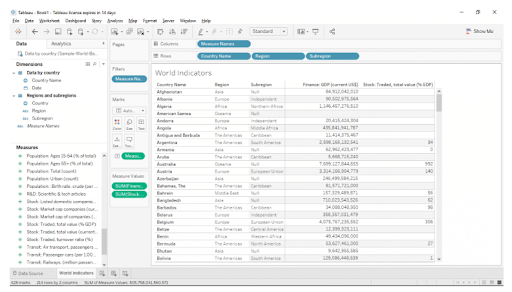
Tableau workspace comprises the following sets of things such as toolbar, menus, data windows, cards, legend and sheets, dashboards,and worksheets, etc. Worksheet hotels the sheaves that can be customized for effective use. In the shelves data fields are dragged so as to build views. Similarly the dashboards hold legends, filters and views.
The following image depicts all the components of the baleia workspace.
Data Window:
- The data field resides in the data window on the left side of the workspace.
- You can hide and view the Data window by selecting Window > Show Data Window.
- You can also press the Minimize button at the top right corner of the Data window.
Status Bar:
- It is placed at the bottom of the workbook of the Tableau.
- It displays explanations of the menu items as well as information on the current view.
ToolBar:
- Tableau's Toolbar includes a command including Data Link, New layer, and Save.
- It also includes analysis and navigation tools such as Type, Group and Highlight.
Cards and Shelves:
- The worksheets contain different types of cards that can be shown or hidden.
- They act as containers for shelves, legends, etc.
- They also are shown or hidden, rearranged around the worksheet.
You can see the placing of cards and shelves in the following image
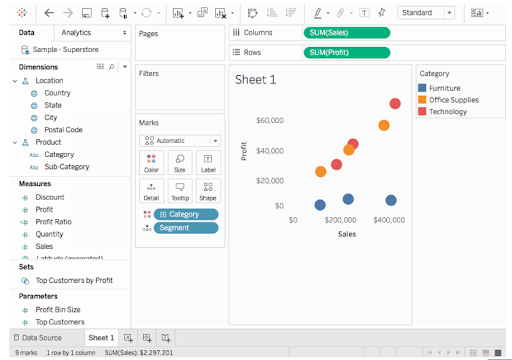

Tableau Certification Training
- Master Your Craft
- Lifetime LMS & Faculty Access
- 24/7 online expert support
- Real-world & Project Based Learning
5. Building views in tableau:
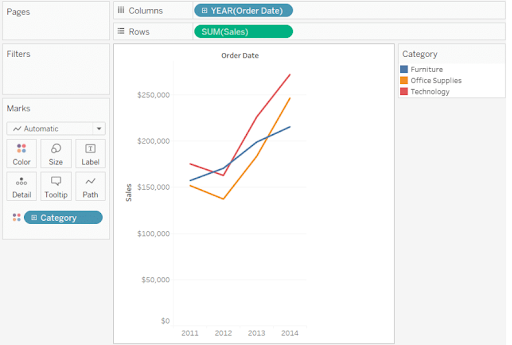
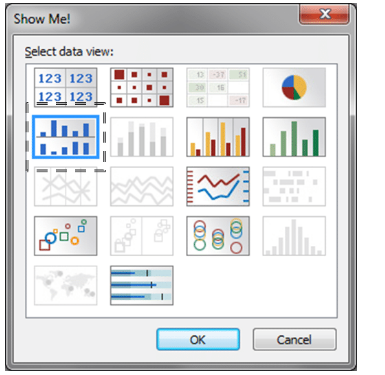
In order to create a view in Tableau, you can drag the fields from the Data window and drop the fields on the shelves that are part of all Tableau worksheets.
- Select File > Save or press Ctrl + S on your keyboard.
- Browse to a file location to save the workbook.
And by default all your workbooks will be saved in the workbook directory of the tabelu repositories. You need to specify a filename for your workbook as well as the files type such as .twb or .twbx.
6. Tableau Data Source Connections:
There are several ways to connect data sources in tableau. In order to examine your tableau data first you need to connect your tableau to any of the data sources. The data source can be an excel worksheet, SQL server or an Oracle Data warehouse. After linking, data fields are displayed in the Data window on the left side of the workbook.Tableau supports various array data sources, such as multi-dimensional databases, SQL databases, etc.
Related Article: Tableau Parameters
Now we are going to learn how to connect to the tableau data source and connect to a custom SQL query.
Follow these steps to connect to the tableau data source. They are
- First connect tableau to the data source so as to build views of the data.
- Next you can easily connect to any supported data sources with the help of a dialog box.
- Select Data > Connect Data or click Ctrl+D on your keyboard. You can also choose the option Connect to Data on the start page.
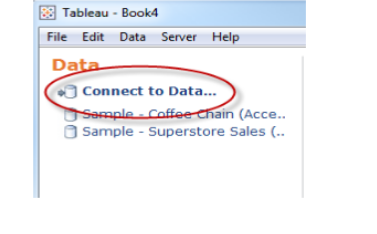
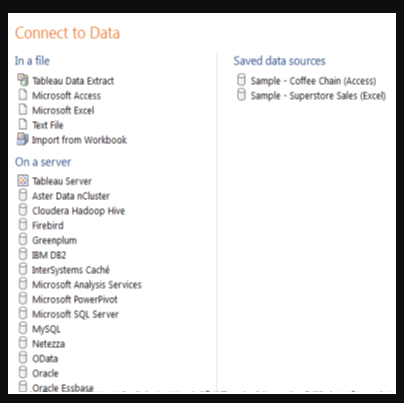
Opens a specific Data Source dialogue that helps you to complete the connection process. To connect to array data in a particular way, you need to import the data from a workbook. There are several worksheets in the workbook, each of which can be added to a separate table of various data sources. To import a connection from a workbook, press the Import from Workbook button at the bottom of the Select Saved Connection tab in the Data Connection dialogue box.

Subscribe to our YouTube channel to get new updates..!
If the connection is formed, the array data sources fields are displayed in the Data window on the left side of the workbook.
Connecting tableau to a custom SQl query:
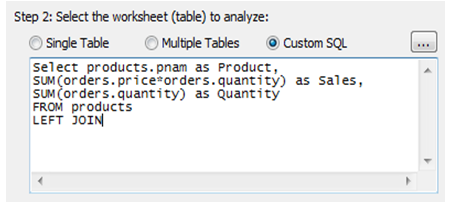
Relational data sources that can be connected to a particular query rather than to the entire data source. This can be useful if you know the details you need and understand how to write SQL queries correctly.
- Pick Custom SQL from the Link dialogue box.
- Type or paste the question in the text box. The button in the upper right corner of the text box opens a wider edit window for more complicated queries.
Next we are going to learn how to export database connection in tableau.
7. Exporting Database Connection in Tableau:
After connecting to the data source, we now have to export the link data as an alternative route that allows fast connections while opening the connection dialogue box. If you frequently connect to a similar data source many times, or if you have attached custom fields to the Data window, such as measured fields, binned fields, or joined tables. Use the alternative route or shortcut for the following connections to that source so that you do not have to re-establish custom fields.
8. Data Blending and joining tables in tableau
When the data is blended from multiple sources on a single worksheet, it is referred to as data blending. The information is connected to the common dimensions.
Does not build row-level joins . So this is not a way to add new dimensions or rows to your results. It can be used when you have similar data in a variety of data sources that you want to analyse together in a single view. To combine a data blending array, you should first add one of the common dimensions to the view from the primary data source.
In order to blend data on the worksheet needs the following steps.
- First connect to the sample, i.e the excel spreadsheet and then build views by specifying the categories.
- Select the data and connect to the data and then connect it to the spreadsheet.
- Just drag the spreadsheet to know or measure the details of the shelves.
- Just do right click on the spreadsheet and add the reference line.
- A reference dialog box will be opened, add the reference line and then click ok.
- Now the worksheet is pulling the data from the secondary data sources so as to compare both the actual and forecast parameters.
Tableau joins:
Multiple relational data sources consist of a set of tables which are related to specific fields. For example, a table to enter data sources for an organisation which include an employee table containing the employee's first name, last name, telephone number, etc.
If you first connect to the Data Source array using the Connection dialogue, you can connect to multiple tables. Here you can add tables, enter tables, and change field aliases if you are likely to have named fields in each table. If you've already linked to the data source, you can add the tables as well. This section discusses how to link to a number of tables and how to add tables to the Data window.
Connecting to multiple tables:
Follow the below mentioned step to connect to the multiple tables.
- You need to select the table and then go for the multiple tables option as shown below.
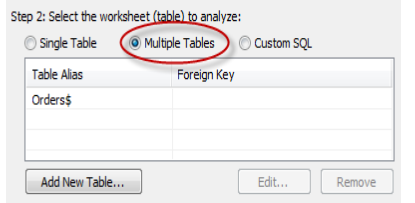
- Then click add a new table button that is displayed at the bottom of the screen, as shown in the above image.
- Next select the table to add the data window in the add table dialog box.
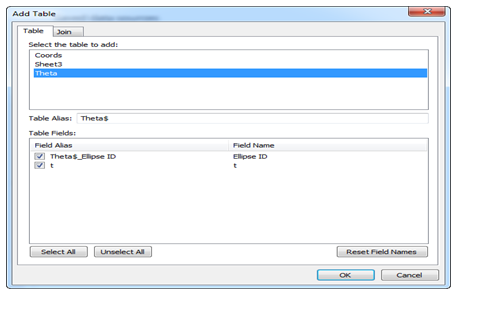
Connect to this by clicking the Join tab.Tableau will automatically create a connection for you based on the formation of your data. Click the Joins tab to check the Join Clause to make sure it is the way you want to connect the tables.

You can delete useless Join Clauses by selecting them in the Join Clauses catalogue and clicking Delete.By selecting a field from the original table, a field from the added table, and an operator, you can add one or more joining clauses to the attached panel. After that, press the Add button to add it to the Join Clause list.
According to the earlier discussion data source, two tables have order information and user information, so we can enter both tables based on the region area. Select Region in both field lists, select an equal sign as an operator, and then press Add.
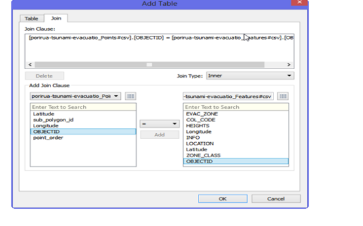
Note, you can’t nest Inner joins inside Left or Right joins. Because these joins will cause a join expression not supported error.
When finished, click OK.
In connection dialog box tables are listed with the foreign keys.
End the connection by giving it a name and clicking OK.
When we add Tableau join tables, Group by table command is used when the data window is automatically organized. You can turn off this feature or change how the Data window is sorted using the Data window menu.
Adding and editing tables to the data window:
In order to add tables to the data window, you need to focus on the following points.
- First select the data source on the data menu and then select the edit tables.
- In the table dialog box, click add new table.
- In the Add Tables dialog box, select a table to add. Complete the dialog box by defining at least one tableau data joins clause and optionally changing field aliases.
- When finished, click OK and then OK again to close the dialog boxes.
- When you connect to several tables you are necessarily connecting to a denormalized view of the data source. This means that all queries are run against all tables and it is possible for some measures to be overcounted.
Editing tables:
By using the tables command you can easily edit the tableau data join tables. In order to edit just select the data source on the data menu and then select the edit tables. In the tables dialog box, just select the tables you want to modify and click on the edit. You can change the table and field aliases as well as add and delete fields from the Data window in the following dialogue box. Choose the Join tab to edit the attached clauses. When done, press OK twice to close the Tables dialogue box.
9. Extracting data in Tableau:
To boost performance and data to allow more advanced functionality and to analyse offline, you can use table data extracts which are stored subsets of the data source. You may make an extract of Tableau data by specifying philtres and limits that include the data you want in the extract of the collection.
After building a Tableau data extract, you can reload the data from the original data source. You can either update the data, replace all the contents of the table extract data, or you can add a table extract that only adds rows that have been new since the last refresh.
Tableau data extracts can helps in:
- Improving the performance.
- Creating tableau extracts
- Adding rows form a file
- Optimizing tableau extracts
- Refreshing tableau data extracts
- Provide access to offline data.
10. Creating tableau dashboards:
Follow these simple steps to create dashboards in the tableau. They are;
- Just right click on the tab list and select the new dashboard form the context menu.
- Click the New Dashboard tab at the bottom of the workspace, or select Dashboard,from the drop-down menu.
- A blank dashboard will appear with the Data window replaced by four sections: a list of existing worksheets in the workbook, a set of additional dashboard elements in the layout section containing the arrangement of items added to the dashboard, and a section for customization of the dashboard element sizes.
11. Tableau Vs BI:
Tableau is a powerful and fastest-growing data visualisation tool used in the business intelligence industry. It allows you to simplify raw data into a very easily understandable format. Power BI is a Business Intelligence and Data Visualization tool that helps you convert data from different data sources to interactive dashboards and BI reports. It also offers a range of device connectors and facilities.
Conclusion:
Tableau is very easy, fast, to create data visualizations.It lets you combine form and clean data for study. It lets you manage a large amount of info. Using scripting languages such as Python, R to avoid performance for complex table calculations. Allows users to use Tableau Desktop to build reports, dashboards, etc.
About Author
Ishan is an IT graduate who has always been passionate about writing and storytelling. He is a tech-savvy and literary fanatic since his college days. Proficient in Data Science, Cloud Computing, and DevOps he is looking forward to spreading his words to the maximum audience to make them feel the adrenaline he feels when he pens down about the technological advancements. Apart from being tech-savvy and writing technical blogs, he is an entertainment writer, a blogger, and a traveler.
Upcoming Tableau Certification Training Online classes
| Batch starts on 12th Feb 2026 |
|
||
| Batch starts on 16th Feb 2026 |
|
||
| Batch starts on 20th Feb 2026 |
|


