
QlikView Tutorial
Last updated on Jan 22, 2024

- Introduction to Qlikview platform
- Qlikview overview
- Features of Qlikview
- Qlikview architecture overview
- Qlikview - Data loading
- Qlikview - Resident load
- Qlikview - preceding load
- Qlikview - Data files
- Qlikview - Scripting
- Qlikview - functions
- Qlikview - List box and Multi box
- Qlikview dimensions and measures
- Similarities and difference between Tableau and Qlikview
- Benefits of Qlikview
- Conclusion
Introduction to QlikView platform:
QlikView is one of the top business intelligence tools which provide an end-to-end platform service. The main operations of the QlikView tool included are data integration, user-driven business intelligence, and data analysis. The QlikView business tool helps the user to convert the raw data into a useful one. This tool sometimes acts as a “Human brain” and mainly works on business associations. This software tool was first found in 1993 in Lund, Sweden, and is now based in King Of Prussia, Pennsylvania, United States.
One more important thing about QlikView is that even non-programmer also explore the visual data information view. With the help of clicks and taps, users can stream the QlikView stream of various questions. QlikView software engine helps to calculate the new information, and data report. The word “Qlik” stands for software vendor data visualization, dashboard executives, and self-service business intelligence platform. This is one of the most data visualization platforms when compared to other products such as Tableau and Microsoft.
QlikView overview:
As is said earlier, QlikView is one of the most demanding business intelligence tools. This tool is used to maintain the relationships between the data and visual colors. Users can also perform direct as well as indirect searches by using various searches in the given list boxes. One more important thing about QlikView is that this helps in the calculation of aggregated data and data compressions. Neither users nor software developers of the QlikView application manage the relationship between the various data sources, but this is managed automatically (you can say by default it happens).
Features of QlikView:
QlikView business intelligence tool comes up with advanced features. Following are the list of QlikView features:
- Automatically maintains the data association: QlikView tool automatically identifies the relationship between the data present in a data set. With the help of this feature, users need not recognize the relationship between the various data entities.
- Data will be held in the memory available for multiple users and offers a super-fast user experience: Here the data structure and calculations of a data report will be held in the RAM memory of the server.
- Aggregations can also be calculated on the fly: As data will be held in memory, the user performs a calculation task on the fly. Here there is no need to store pre-calculated aggregate data values.
- Data will be compressed to 10% of the original size: QlikView platform developed on the base of data dictionaries. Only essential data sets will be used for analytical purposes and this compresses the original data to a small size.
- Visual relationship by using colors: With the help of this feature, the relationship between the data will not be shown by lines and arrows. All you need to do is select a piece of data by click on specific colors to specify the related data and another color to specify unrelated data.
- Direct and indirect searches: Because of data association you can input some data and get the exact results. With the help of this feature, you can also search for the data value directly.
Top 30 frequently asked QlikView interview questions & answers for freshers & experienced professionals
QlikView architecture overview:
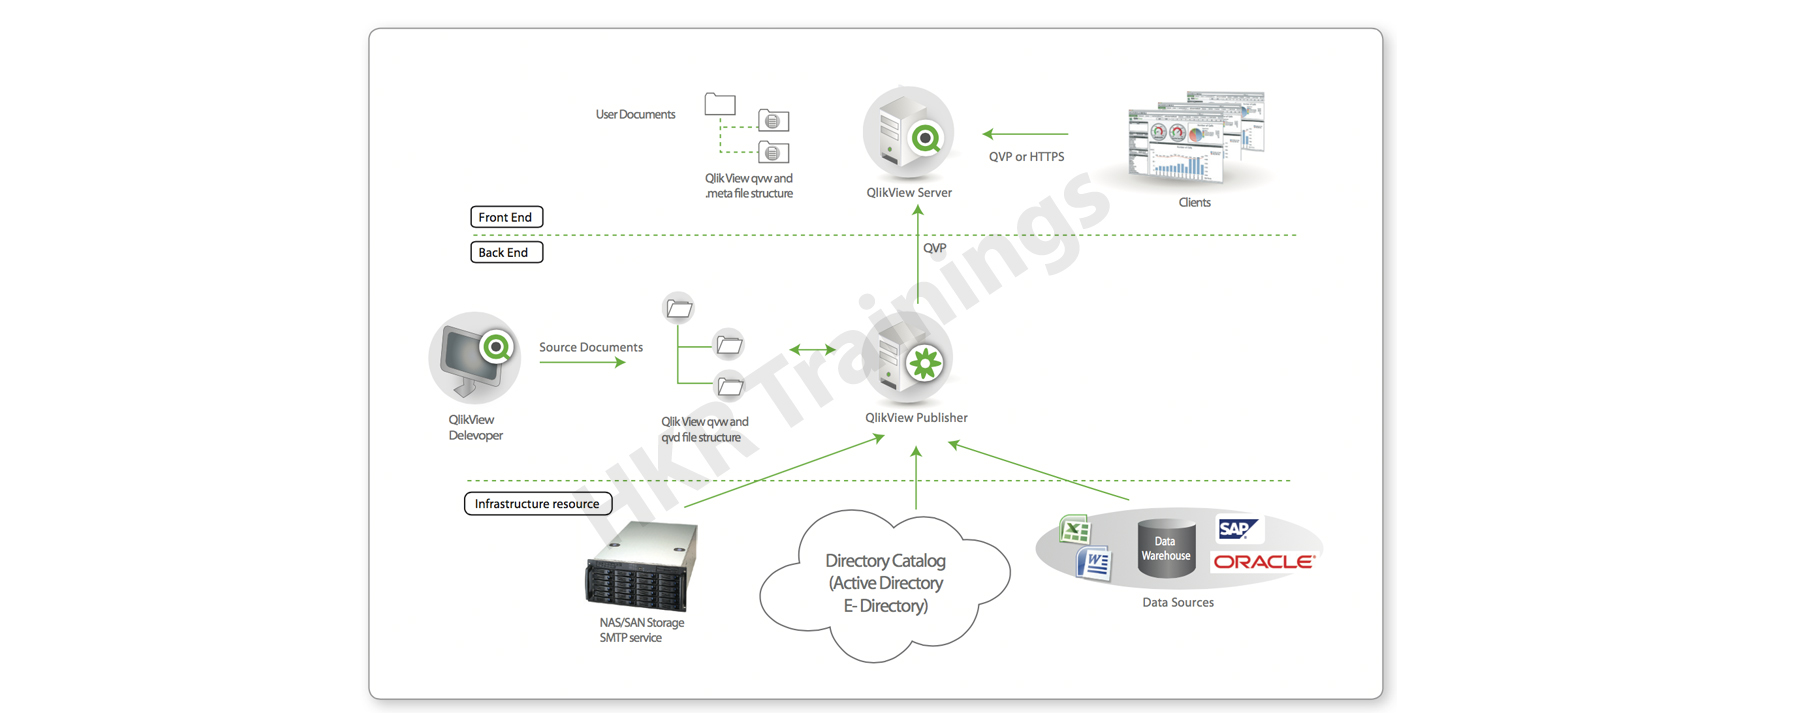
The below diagram explains the components and their working environment. So let’s learn each component one by one:
The QlikView architecture consists of two major components such a front end and a back end. Here the front end helps in the visualization of the data process and the back end used to provide security and publications.

Qlikview Training Certification
- Master Your Craft
- Lifetime LMS & Faculty Access
- 24/7 online expert support
- Real-world & Project Based Learning
Front end:
The front end is a type of browser-based access point. Mainly this front view is used to view the QlikView data records. This component consists of the QlikView server, which is mainly used by business users to access the business intelligence reports through different internet URLs and Intranet URLs. Here the business users can explore and interact with data values by using the derived conclusions. They also collaborate with several sets of reports by sharing data insights and exploring the data in a real-time. The QlikView server in the front end also manages the client-server communications between the QlikView backend system and users.
Back end:
Here the back end component consists of two major methods : 1. QlikView desktop and 2. QlikView publishers. The QlikView desktop is a wizard-driven window environment, this is mainly used to transform and load the business data from the sources. It also offers drag and drops features used to create a graphical user interface (GUI) layout of the data reports. The file types are created in the QlikView desktop with an extension .qvw. The QlikView publishers also used it as a distribution service to distribute the .qvw file types. This also helps to access the data values only by authorized users.
QlikView – Data loading:
The following are the important types of data files that can be loaded in QlikView.
Excel file loading:
The QlikView platform accepts the Excel spreadsheet for the data analysis purpose by simply using drag and drop actions. The navigation is as follows ->first, you need to open the QlikView main window -> then drag and drop the excel file type into the interface-> this will automatically create the excel spreadsheet by showing the excel data.
Delimited file loading:
The QlikView platform can be used to load the data value in a plain text file here the fields are separated by various characters like comma, tab, equals semicolon, etc. Here we have taken the CSV file as an example. In the CSV file, each column of data is separated by a comma. This one is a widely used file format to store the plain text in the form of columns and rows.
XML file loading:
The XML file format is used to store both the file and data formats on the World Wide Web, and internets with the help of ASCII characters. XML stands for extensible markup languages and available in the form of HTML markup tags. The navigation to load the data from XML files is similar to the data loading of the delimited files as follows; first, open the script editor -> click on the menu-> insert -> load the statements from the file-> finally browse for the XML file.
[Related article: Incremental Load in Qlikview]
Web file loading:
QlikView can process the files from the web browser which are available in HTML formats. This can extract the data from HTML tables, here the URL of the web file will be processed as input and the QlikView tool fetches both structured and content file types. To perform data extraction using a web file you need to choose web files from the -> data from files -> under the data tab -> from the script editor.
Database connection:
QlikView can connect various popular databases like Oracle, PostgreSQL, SQL Server, and MySQL. This can fetch the data and table structures into the QlikView environment and also helps to store the result in the memory for the analysis purpose.
QlikView- Resident Load:
QlikView can load the data from table structure which is already existing in the RAM memory and is processed by script data. These requirements help you to create a new data table and an existing data table, but these two files should be in the same script.
First, let us know how to create a load script:
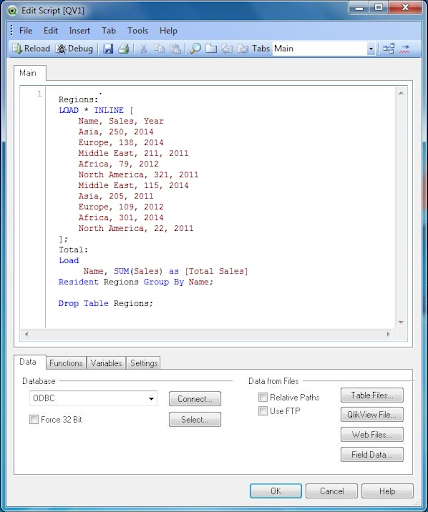
Create the load script:
To create the load scripts -> first open the script editor (or you can use Control + E) -> then mention the script name -> now create the inline table regions -> create table name called Total -> then drop the table regions (here the file type should be in .qvw file -> table named Total for data analysis.
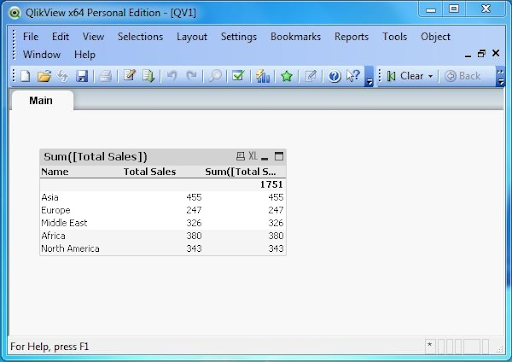
Text box data:
Create the table box sheet object -> you can see the data that is read from the resident data load option
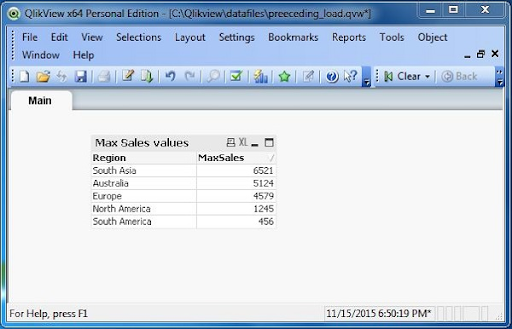
QlikView – Preceding load:
QlikView preceding load is a type of data load type where we can make use of load statements. This loaded statement takes the columns of another load statement in the same script. The first load statement will read the data and load them in the script editor window.
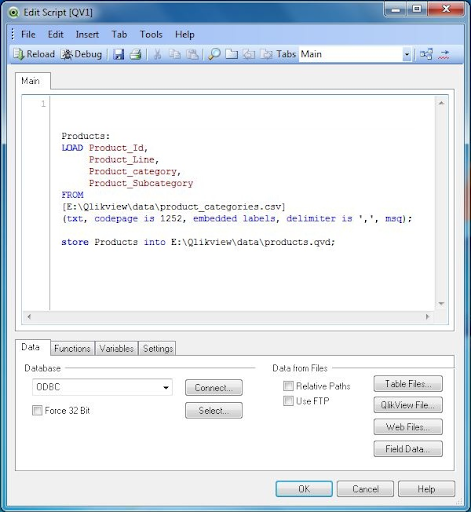
Load script:
The below screenshot will show how to script the data and load them as inline data and the max function is applied to one of the data columns. The load statement available at the bottom of the QlikView’s memory, this is used by the second statement. The second load statement applies with the help of a group of clauses.
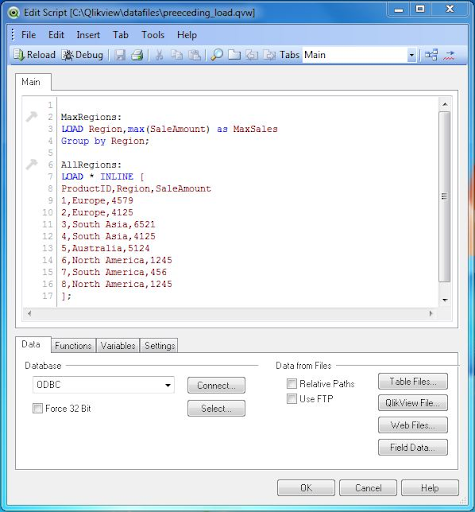
Table box data:
Once you created the table box sheet object, you can see the data that read from the inline data load options. The following screenshot will explain this;
QlikView- Incremental data loading:
As you increase the data volume, the QlikView document increases, so the time taken to load the files will also increase. All these processes cause the slowdown of the data analysis. There is an approach available to minimize the time taken to load the data in the new resource or upload ones. This approach of loading new or changed data records from the source into the QlikView document is known as the Incremental load method.
[ Related Article: incremental data ]
To identify the new record or data from the source, we use either a sequential or data timestamp for each row. These keys should be of unique data limit and flow from the QlikView document.
QlikView – Data files (QVD):
This is one of the important methods used to store a large amount of data in a compressed size and store the data in the form of QlikView documents. Therefore, once you created the document then no need to connect to any data source, as the data is ready to store along with the document layouts. This process can be achieved through QVD file types. QVD file is a flat-file type that stores the file data with the .qvd extension. This type of QVD file stores the data for one QlikView document and this will be created with the help of a script editor.
Advantages of using QVD files:
- Helps in faster data loading.
- Supports scaling up if the data volume grows.
- This is mainly used in incremental load.
- With the help of QVD file data from multiple sources can be clubbed to one set of data.
- Helps to extract the data in parallel.
Subscribe to our YouTube channel to get new updates..!
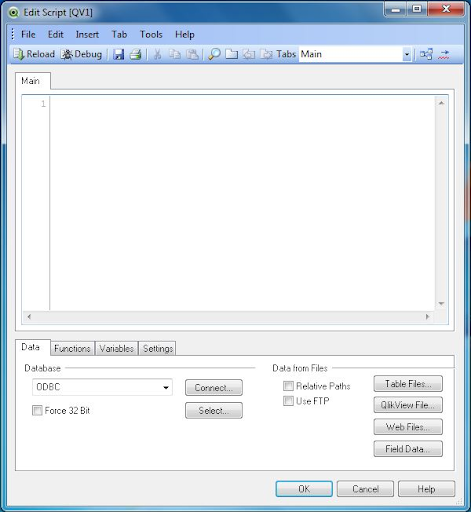
QlikView – Scripting:
The script is one of the powerful features available in QlikView. This feature enables controlling the data load options and data transformation method. The scripting feature also consists of many inbuilt functions and creates the subroutines within a QlikView document. This scripting is done with the help of the Script Editor and accesses the file menu from this editor. You can also perform this by using Control +E to open any script editor window. The following screenshot will explain the script editor.
Below are the important features of Script editor features:
Script editor consists of many features, you can access these features from the menu in the script editor window, and this is different from the main menu. The following are the list of very important Script editor features:
1. File Menu:
- Reload = this feature helps in the reloading of a script and also fetches the data.
- Upper or Lower case = this feature converts the case of the word in QlikView, which should be case sensitive.
- Comment = this feature is used to comment code blocks.
2. Edit menu:
- Clear Entire script = this is used to active script tab.
- Open script file = this is used to open the saved file script.
- Table viewer = this method is used to see the tabular view of the data which is being loaded.
3. Insert menu:
- Environment variables = this helps to insert the standard list of environment variables.
- Script files = this feature allows users to browse the script files and insert them.
- Connect or disconnect statement = used to connect or disconnect the external database.
4. Tab menu:
- Insert tab = used to insert a tab at the current cursor.
- Promote or demote tab = this feature allows moving the tabs from left to right and vice versa.
- Merge with previous = this is used to merge the content off the active tag method with the help of the previous tab.
5. Tools menu:
- ODBC administrator of 64 bits/ ODBC Administrator of 32 bits = this allows setting the correct data structure number information for data sources.
- Editor preferences = this allows you to configure the text fonts and size, helps features, default-scripting engine, and shortcuts, etc.
- Syntax check = this feature is used to validate the syntax of any script code.
QlikView – Functions:
There are 21 types of functions available in QlikView, used to perform specific activities. These functions are used to perform various mathematical operations on the data stored in-memory QlikView.
List of QlikView functions:
Below are the QlikView functions used to perform specific tasks in QlikView.
- Aggregation
- Color
- Date and Time
- Exponential and logarithmic
- Financial
- Counter functions
- Formatting
- General Numeric
- Inter record
- Logical functions
- Mapping functions
- Mathematical constants and parameter-free functions
- None
- Null function
- Number interpretation
- Range function
- Ranking function
- String function
- System
- Trigonometric and Hyperbolic functions.
There are also 4 types of QlikView join functions available, now it’s time to explore the QlikView join function and its types.
1. General numeric functions:
This function type is used to store numbers and integer data types. Now, let’s discuss the types of the numeric function:
- div (x1, x2)
- mod (x1, x2)
- fmod (x1, x2)
- ceil (x[, base [, offset ]])
- floor (x [, base [, offset ]])
- round (x [, step [, offset ]])
2. Range functions:
Herewith the help of this range function, you can perform range functions.
For example:
- rangesum (expr1 [, expr2, …… exprN])
- rangeavg (expr1 [, expr2, ….. exprN])
- rangecount (expr1 [, expr2, …. exprN])
- rangemin (expr1 [, expr2, …. exprN])
- rangemax (expr1 [, expr2,….exprN])
3. Exponential and Logarithmic functions:
These functions are used to perform various exponential and logarithmic functions.
- exp (x)
- log (x)
- log10 (x)
- sqrt (x)
- sqr (x)
- pow (x, y)
4. Trigonometric and hyperbolic functions:
The following are the important trigonometric and hyperbolic functions:
- cos (x)
- acos (x)
- sin (x)
- asin (x)
- tan (x)
- atan2 (y, x)
- cosh (x)
- sinh (x)
- tanh (x)
5. Financial functions:
For example:
1. fv (rate, nper, pmt [, pv [, typ]])
2. nper (rate, pmt, pv [, fv [, type ]])
3. pmt (rate, nper, pv [, fv [, type ]] )
6. Mathematical constants and parameter-free functions:
1. e ()
2. pi ()
3. rand ()
4. true ()
5. false ()
7. String functions:
1. ord (s)
2. Chr (n)
3. len (s)
4. left (s, n)
8. Mapping functions:
1. applymap (‘mapname’, expr [, defaultexp])
2. mapsubstring (‘mapname’, expr)
QlikView – List box and Multi box:
First, let us discuss each box types in brief:
List box:
A list box used to represent the list of all data values in a specific field. If you select the list box will highlight the related data values in the sheet objects. This type of list box helps to analyze the data visualization. It is also useful to follow the drill-down methods in spreadsheet objects. The list box also consists of various search features that allow the user to perform specific searches in the spreadsheets. These spreadsheets are helpful for listing long values.
Multi box:
A multi-box list of all the data values from multiple data fields. This is similar to the list box, but here the selection of data values in the multi box highlights the respective data values in the sheet objects. This also helps in the faster data visualization process. The multi-box is also useful to perform drill-down paths among sheet objects.
QlikView dimensions and measures:
In QlikView, both the dimensions and measures are two fundamental entities, which are mainly used in the data analysis process. For example, let us know the analysis result, “what is the total percentage change in data volume of sales for each quarter?” Here, in this example, each quarter represents the dimensions, and this is the name of the quarter. Here the percentage change in the data volume represents the measures. Below are the some widely used these two terms:
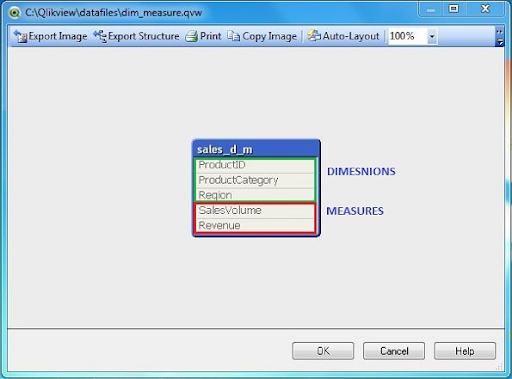
Dimension:
This is a type of descriptive data field which represents the few distinct data values such as Month, Year, and Product ID, etc. *(in terms of sales).
Measures:
This is a numeric data field on which you can perform some calculations for each dimension’s distinct value.
Steps included are:
1.Table structure:
You can see the table structure with the help of this navigation: go to menu file -> table viewer or you can also use the control+T button. The following screenshot will explain this:
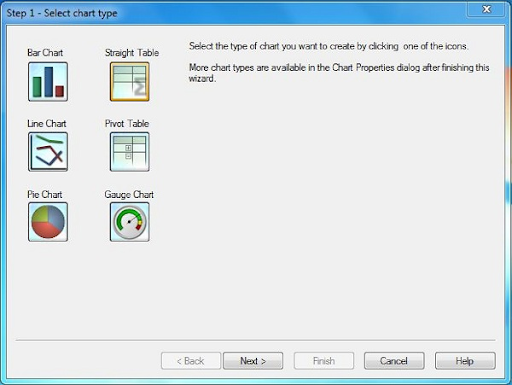
2. Using dimensions and measures:
To perform dimensions and measures as follows: Click on the quick chart wizard -> click on the straight table -> click next button as shown in the below screenshot:
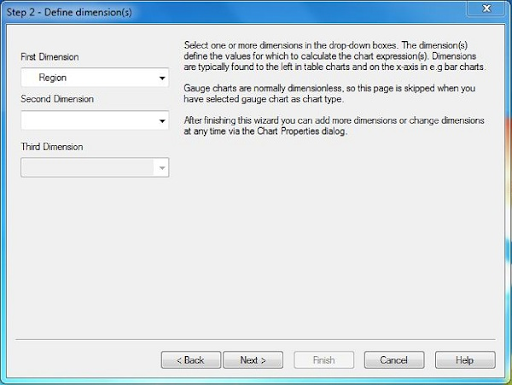
3. Choose dimensions:
In the below screenshot, you need to choose the region as a dimension -> select the total revenue.
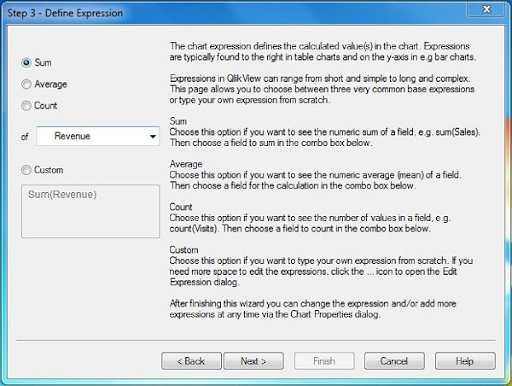
4. Choose measures:
The next screen will explain how to apply the calculation -> on the measured field -> you need to apply Sum on the field revenue.
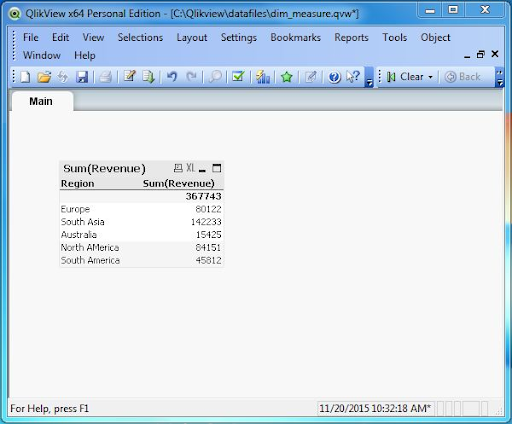
5. Final chart:
Here you will get the final chart to show total revenue (measure) for each region (Dimension).
Similarities and difference between Tableau and QlikView:
First, let me explain the similarities between Tableau and QlikView;
- Both Tableau and QlikView offer a wide range of data visualizations and high-end data analytical capabilities.
- Both Tableau and QlikView tools have an active and widespread social/ user community.
- Users can integrate the data from multiple sources with ease mode.
- Both Tableau and QlikView tools provide high-level mobile compatibility.
- Tableau and QlikView tools support big data, when it comes to Tableau tools it supports slightly above average than QlikView tool.
- Both these tools offer great scalability and high level data storage. But there is a drawback in QlikView because it faces RAM limitations.

Differences:
1. QlikView:
- QlikView tool offers faster data processing than Tableau.
- The QlikView interface is a bit overwhelming when compared to Tableau.
- QlikView is the most suitable and enterprise centric business intelligence solutions.
- This tool is a user-friendly tool and it consists of various data search features.
- This tool offers a greater level of data visualization techniques as it loaded with objects like QlikView Charts, boxplots, waterfall, texts, and charts, etc.
2. Tableau:
- Tableau uses the cubing technique used to process and manage data, so it is slower than QlikView.
- Tableau offers a rich, interactive user, and user-friendly interface. It consists of a simple drag and drop interface.
- It is best suited for the data visualization process as it offers high-end dashboards and rapid data visualization techniques.
- Tableau consists of limited advanced features so it’s not a user-friendly tool.
- This tool offers lesser data visualization because of its limited features.
Benefits of QlikView:
The following are the important benefits of QlikView:
- QlikView allows users to see the result of a selection across the entire schema, not just a limited subset of tables.
- QlikView tool will aggregate at the lowest level of granularity in the expression, not the lowest level of granularity in the schema or query like SQL.
- QlikView allows users to interact with a broader range of data and offers a larger memory to store data when compared to other business intelligence tools.
- Patented technology makes QlikView applications easy to learn for both developers and end-users.
- QlikView combines the data from multiple data sources and helps the customer to view their business applications.
Conclusion:
In this QlikView tutorial, we have tried our best to cover major concepts and their implementations. QlikView is one of the powerful business intelligence and data analytic tools. As per the latest research, this QlikView is better than any other business intelligence tool (Tableau, Power BI, etc.). Learning this tutorial may help you to crack any top company interviews. We already know this is a popular business tool so you can expect huge salary packages.
About Author
Upcoming Qlikview Training Certification Online classes
| Batch starts on 1st Aug 2026 |
|
||
| Batch starts on 5th Aug 2026 |
|
||
| Batch starts on 9th Aug 2026 |
|