Introduction to SPSS statistics:
SPSS is one of the powerful data statistical tools and developed by IBM corporations. SPSS is a combination of powerful packages used to perform statistical analysis, batched, and interactive purposes. This SPSS tool is used by various kinds of researchers to perform valuable data statistical functions. The SPSS software packages are created to manage and analyze data statistics of social science environments. Originally it is an antonym of “statistical package for social science “.
.jpg)
SPSS tool is a comprehensive and flexible statistical analysis and data management tool. SPSS is a computer program to perform important operations like survey authorization, deployment, and mining of data, text analytics, statistical analytics, collaboration, and deployments. This tool is mainly used by big organizations to fetch data from multiple sources.
Why do we need SPSS?
The following are the key factors that will define why the organization needs the SPSS tool.
1. SPSS tool offers user-friendliness that most packages are only now catching up to.
2. SPSS is a graphical user interface or GUI based program.
3. This offers quick descriptive statistical capability.
4. SPSS is one of the most popular packages mainly used in social science.
5. This tool is best suited for cluster analysis.
6. It runs on multiple platforms like Windows, Linux, and Macintosh operating systems.
7. It is less expensive and time-consuming than quantitative experiments.
8. It is used to describe and not make any conclusions.
SPSS Overview:
As I said earlier, SPSS stands for “statistical package for the social sciences” and it was first launched in 1968. Then SPSS Company was acquired by IBM corporations Australia in 2009, now it is officially known as “IBM SPSS statistics “ but most people still prefer “SPSS”. This SPSS software is used for “editing and analyzing all sorts of data”. These types of data may generate from multiple sources such as scientific research, google analytics, a customer based database, and even as a log file from any website sources. SPSS tool opens all type of file formats that are mainly used for structured data formats such as;
1. Spreadsheets from MS excel or MS open office.
2. Plain text files formats (it can be .txt or .csv).
3. Relational database or SQL.
4. Stata and SAS types.
SPSS Architecture:
SPSS architecture explains the overall functionalities, components, and work nature of the tool. The following diagram explains the overview of the architecture and its functions.
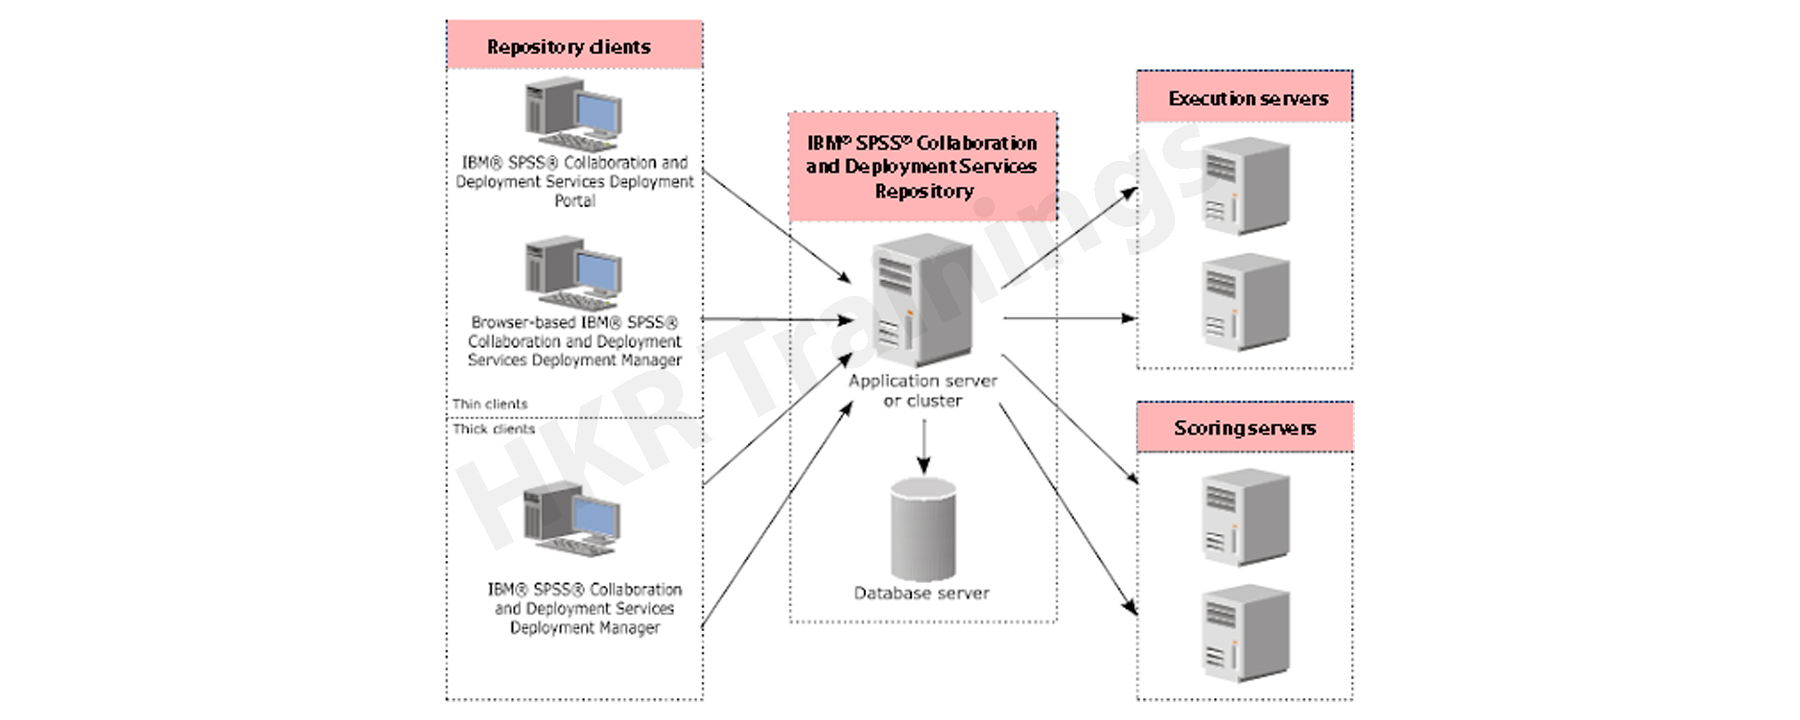
In general, the IBM SPSS tool offers collaborative and deployment data service that mainly contains a single based and centralized service repository system. This service offers a variety of clients, to execute the variety of servers to process the analytical assets.
The following are the building blocks of SPSS:
1. SPSS collaborative and deployment service and repository analytical artifacts
2. SPSS statistics
3. SPSS modeler
4. SPSS deployment manager
5. SPSS deployment portal
6. Browser-based SPSS deployment manager
In normal, the IBM repository offers a centralized location to store data analytics and modeling of data. This type of repository is also used to perform the installation of relational database management tools such as IBM Db2, Oracle database software, and Microsoft SQL database server. The deployment manager helps users to schedule, execute, automate, update and generate the scores. IBM SPSS collaboration and deployment service is a deployment portal that serves the web portal activities.
SPSS data Editor Windows:
In general, SPSS statistics data will be stored in the type of data files, which are designed to handle IBM SPSS statistics. In this section, we are going to learn different data forms and how to use them:
1. Reading the data files:
Here users can import the data from multiple sources and store them manually. Now it’s time to know how to read the stored data,
a. IBM SPSS statistical data files
b. Database application servers
c. Text data files
d. Spreadsheet applications
The steps included are:
1. Reading the statistical data files in IBM SPSS:
IBM SPSS data files are saved in the file with the .sav extension. With the help of the following steps you can open the saved data:
a. First open the “menu” -> go to “file”.
b. Now select “open”
c. Click on the “data” button
d. Search for the file which is saved in .sav and open it.
e. The data editor will display the data in the file.
2. Import the Excel database into SPSS:
Consider the below steps to import the excel database into SPSS:
a. First open the “spss” window.
b. Now select the “file” menu button.
c. Click on the “Open database” button and select the “new query” button as shown below:
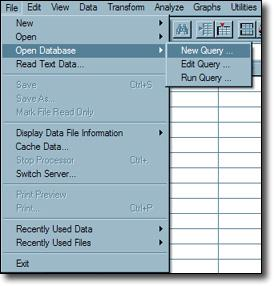
d. Now open the SPSS database wizard-> click on the “Excel files” in the window.
e. Click on the “next” button.
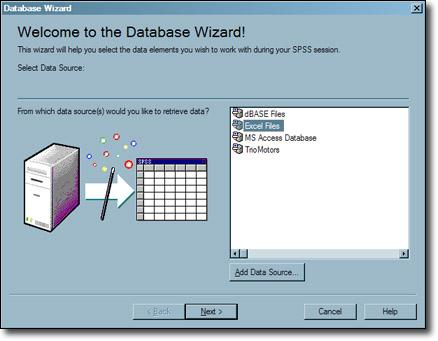
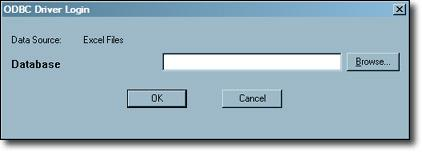
f. Select the browse button -> from the ODBC login window.
g. Now browse the required database files -> press enter the “open” button as shown below,
2. Reading the data from a database:
From the database, the data will be imported with the help of a database wizard. Here you need to install the database drivers to read the data directly from the database. Open database connectivity (ODBC) is mostly used to format the different databases. Any type of database within the driver can read the data easily. To perform this, installation CD will be available for it, and additional drivers also available by third-party vendors.
3. Reading the data from a text file:
In this section, we are going to explain the steps required to read the text file in SPSS. In general, the text files are stored in a file with the extension .txt. The following steps will explain this;
a. Select the file menu -> then read the text data.
b. Now browse the data file that you want to read -> then the dialog box will open.
c. Click on the required file name awards. txt (a simple file) -> then press the open button.
d. The text import wizard -> that appears on the screen that is used to load the data. Now you can format the data files as per your requirement.
e. Check the input data -> then press the next button.
f. Mention the data where the read is delimited.
g. Now click on the Next button.
h. Now SPSS interprets the text data files.

SPSS Online Training
- Master Your Craft
- Lifetime LMS & Faculty Access
- 24/7 online expert support
- Real-world & Project Based Learning
SPSS syntax introduction:
SPSS syntax is a type of language that contains the instructions to analyze, edit the data, and also to work with other SPSS commands.
In normal, SPSS users usually work directly from the menu where they can’t see the syntax which is running. Let me explain them one by one:
1. SPSS syntax – paste
To perform the paste task, the user should follow the navigation Analyze -> go to Descriptive statistics -> then click on the “frequencies” button. Now click on the “ok” button, and to know it in a better way -> click on the “paste” button. After doing this, a new SPSS window will open which is known as the “syntax editor”. This is recognized by an orange icon that appears on the left top corner.

Here the syntax editor consists of the FREQUENCIES command this holds the important instruction as shown in the frequencies dialog window.
2. SPSS syntax – Run:
The simplest way to run the syntax is by selecting the command (), that you want to run and then click on the “run selection” button available in the toolbar. Most of the users prefer to use short keys to run any command:
a. “F2” button to select the command where your required pointer is located.
b. “CTRL” + “a” to select all types of syntax.
c. “CTRL” + “r” to run the selected all commands.
Now it’s time to run the already pasted syntax. After doing this, a new window will be opened that consists of a frequency table and bar chart. This is also called an output window.
3. To get SPSS syntax:
Usually in this step, we will perform editing, and data analysis to create the tables and charts. The below are the important steps to perform this task,
a. First use the “paste” button that is available in menus.
b. Now drag and drop the syntax file -> from the data editor window.
c. Click on the new syntax toolbar.
d. Now navigate to File -> new -> then go to syntax.
e. Now use the “Paste” button from the SPSS menu bar.
f. Click on Copy and paste syntax button.
g. It’s time to type the commands on the command window.
Writing the simple syntax:
The syntax is as follows;
frequencies gender
/barchart.
Now just type and run the commands much faster and easier through menu options.
4. SPSS syntax files:
Here user can save all the written contents using Syntax editor in the form of syntax files just by following this navigation file -> go to save as -> then resulting file will be visible in the form of .sps file extensions and a plain text file-> open, edit, and save it in SPSS format or any text editor (for example notepad++).
Why even use SPSS syntax?
The reasons are as follows;
1. Here the user will know exactly which steps to use next and order-wise, and you are also able to prove the results are true.
2. If you make some mistake also you can modify it and return everything in a second.
3. With the help of syntax, you can work faster than any standard menu toolbar. This step enables users to never have to repeat things twice.
4. The best way is that SPSS tricks and time savers are available in syntax only.
SPSS missing value:
As I mentioned in the SPSS definition, SPSS is mainly used for data statistical and analysis purposes. So with the help of IBM SPSS, users can predict the missing data values and setting the missing values.
1. SPSS system missing values:
a. System missing values are types of values that are not available or absent from the data. You will get them as a period in the data view.
b. Some respondents will not ask any questions due to a lack of questionnaire routing.
c. If respondents skipped some questionnaires.
d. Something went wrong when you performed conversion or data editing.
2. SPSS user missing value:
1. User missing values are the type of values where they are invisible during the time of analyzing and editing data. Usually, the SPSS users specify which data value or if any or must be excluded.
2. For categorical data variables, answers for questions like “don’t know” or “no answers” are excluded from the analysis.
3. For metric data variables, here the values like time of 50 ms or a monthly salary of about $9,999,999 are usually set as a user missing data values.
The programming example for user missing values for categorical variables:
An easier way to inspect the categorical variables by running the “frequency distribution” and “corresponding bar charts”, and run the following syntax to get more idea;
*show both values and value labels in succeeding output.
Set number both.
*basic frequency table for q1.
Frequencies q1 to q9.
The output looks like this:
3. Programing example to missing the values for metric variables:
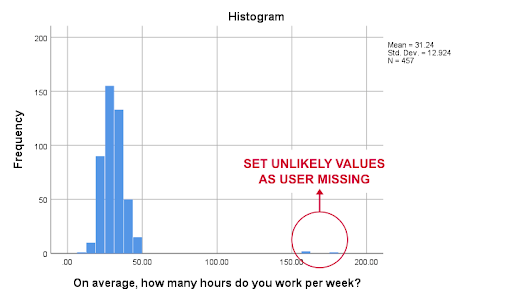
The correct way to inspect any metric variables by running histograms. The syntax shows how to inspect missing variables in an easier way;
*run basic histogram over working hours per week.
Frequencies hours //working hours
/format notable
/histogram
The output is as follows:
Inspecting missing values per variable:
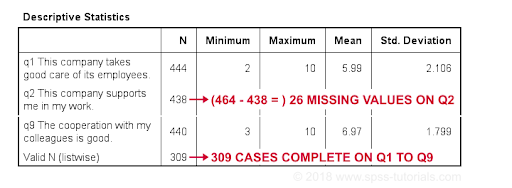
The best way to inspect any missing value is to run the basic Descriptive table. You should be careful while performing this task and make sure you don’t have any “WEIGHT” or “FILTER” options. To check this, follow the syntax:
SHOW WEIGHT FILTER N.
The program code is as follows:
*check missing value per variable.
descriptive q1 to q9.
*note: (500 – N) = number of missing values.
The output looks like this way:
Inspecting missing values per case:
To inspect any missing values, we should create a new variable. This type of variable consists of the number of missing values and analyzes them together. The syntax is as follows;
*create a new variable holding the number of missing values over q1 to q9.
Count mis_1 = q1 to q9 (missing value).
*set description of mis_1 as the variable label.
Variable labels mis_1 “missing values over q1 to q9”.
*inspect frequency distribution missing value.
frequencies mis_1.
The output looks like this way:
SPSS Data Analysis with missing values:
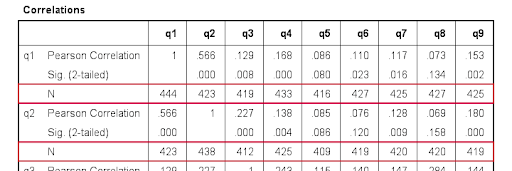
Here SPSS runs each analysis on required cases to find out the missing value. The below syntax will help you to analyze the missing value:
This is considered to be the simplest way to just run this process,
correlation q1 to q9.
After running this syntax you will get the below output:

Subscribe to our YouTube channel to get new updates..!
Listwise exclusion of missing values:
Now you should return the same correlations after inserting a line to syntax:
Correlations q1 to q9
/missing listwise.
The output looks like this way:

SPSS factor analysis:
In this section, we are going to explain the factor analysis and its types. Now let’s discuss the definition of factor analysis:
Factor analysis is a type of statistical technique used to identify the required data factors. All these factors will be measured by a larger number of observed data variables.
These underlying factors are also other types of variables where these variables are difficult to measure factors like IQ, depression, and extraversion. To measure these factors we have to try multiple questions that are least reflect such factors analysis. The following diagram will give you the basic idea of factor analysis:

There are two types of factor analysis available:
1. Confirmatory factor analysis:
In this type of factor analysis, we should measure the questions range from 1 to 9 on the basis of a simple random of the respondent, and you need to compute this correlation matrix at the end. This is also kind of confirming a model that fits by data used and this method is known as “Confirmatory factor analysis”.
Point to be noted: SPSS tool does not include this confirmatory factor analysis and if anyone is interested to work with this analysis, prefer AMOS.
2. Exploratory factor analysis:
You might don’t have any idea which or how many factors are represented by data. To perform this, you should use some model that includes a correlation matrix. Here our task is to explore the data and this process is known as “Exploratory factor analysis”. Another definition is as follows, exploratory factor analysis is software that tries to find the group of data variables and which are highly interconnected. Each group also represents the common factor. This is a different mathematical approach to accomplish the method and one such method is called “principal components analysis or PCA”.
Research questions and data:
In this step, our main task is to research the data; to do this you should use the dole-survey.sav method.
The steps included are:
1. To find out how many factors will be measured by our 16 questions.
2. To find out which questions measure similar factor analysis.
3. Which satisfactory aspects are represented by which factors?
Core functions of SPSS:
In this section, there are four programs offered by the SPSS that help to guide the researchers to perform complex data analysis requirements. Let me explain these programs;
1. SPSS statistics program:
The SPSS statistics program offers a plethora of basic statistical functions. This type of consists of the following functionalities:
a. Frequencies
b. bivariate statistics
c. Cross tabulations.
2. SPSS modeler program:
The modeler program guides the researchers to perform their various research operations like implementing and designing the predictive models to support advanced mathematical-statistical measurements.
3. Text analytics for survey programs:
To perform any survey program, SPSS text analytics helps the survey administration. They specify the suggestions given on the basis of the responses to any survey-related questions.
4. Visualization designer:
The visualization designer program of SPSS allows researchers to create large visual value types such as radial box plots with the help of their own data.
The SPSS also consists of a data management process that makes the complex program simple and easier to understand. It also helps researchers to perform the case selection process, derived data generation, and file reshaping.
The SPSS is the popular solution to perform multiple tasks such as data documentation, and easy to save their confidential data like metadata dictionary. The data dictionary acts as a centralization repository process during the run time environment.
SPSS variable types and formats:
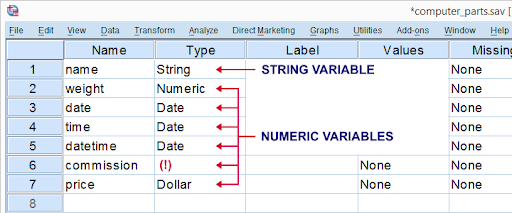
SPSS variables types and formats allow users to get things faster and easier. There are two types of variables available:
1. Numeric variables: this type of numeric variable contains only numbers and is suitable to perform numeric calculations such as addition and multiplication operations.
2. String variables: this type of string variables contains letters, characters, and numbers. Here you can’t do any calculations on string variables and if it contains numbers you can perform calculation operations.
There are no other variables types available other than numeric and string. A numeric variable contains several different formats and variable types. You can also change a string variable to numeric or reverse ALTER type.
The following screenshot explains the variable types:
SPSS variable formats:
The SPSS variable format includes both string variable and numeric variables that contain only numbers. SPSS can display numbers in a very different way. This way of displaying data values is known as a variable format.
Here “Type” is used to show any confusing mixtures of variables types and variable formats. The syntax is as follows:
display dictionary.
Here you can find the two types of variable formats:
1. A or “Alphanumeric” is the general format for string variables.
2. F or “Fortran” that specifies the standard numeric variables.
Variables formats always end with numbers, which indicates the number of characters to indicate. If you find the periods, this specifies the number of decimal places to be displayed.
SPSS for data analysis survey:
The following are the key points of SPSS data survey analysis:
1. To perform manipulation of data, it’s always good to use the SPSS tool to make use of overall benefits. This is the best tool for the statistical analysis of survey data.
2. Users can also export the data in the SPSS tool for statistical analysis purposes. This type of survey is generally gathered by SurveyGizmo can also be used.
3. The saved data using .SAV extension file and with the help of this you can also apply the manipulation process and data analysis etc.
4. With the help of this data analysis survey, the SPSS tool automatically specifies the default data variables names, value tables, and types. This process also reduces the time and workload of the data researchers. You can also get the number of features and opportunities in the SPSS tool.
5. SPSS is also a more customizable and flexible tool that you can use as per your requirement. You are able to find the solution for the complex data sets and easy to develop the analysis predictive model.
Examine the summary statistics:
Here you can see different summary measures for different types of data and levels of measurements.
1. Categorical: the categorical data indicates the data with a limited number of values and categories. This can also be referred to as the quantitative data to perform procedure works.
2. Nominal: In this type of categorical measurement you can’t find any inherent orders. For example, the actual job category of sales is lower or high than any job research category.
3. Ordinal: In this type of categorical measurement consists of meaningful order of categories. And here you can't find any measures to calculate the distance between the categories.
4. Scale: this means that data is measured on the basis of a ratio scale. The data value represents both the distance and the order of the values.
Conclusion:
In this IBM SPSS tutorial, you can find both theoretical as well as practical contents. In this modern world, we make use of millions of data, which is generated from multiple data sources. The IBM SPSS tool is developed to handle all types of information. With the help of the SPSS tool, users will get useful data insights and also be able to solve complex problems. As I said earlier, this SPSS tool also helps us to perform predictive survey analysis and examine the statistics by using different measurements.
other Articles :
About Author
As a senior Technical Content Writer for HKR Trainings, Gayathri has a good comprehension of the present technical innovations, which incorporates perspectives like Business Intelligence and Analytics. She conveys advanced technical ideas precisely and vividly, as conceivable to the target group, guaranteeing that the content is available to clients. She writes qualitative content in the field of Data Warehousing & ETL, Big Data Analytics, and ERP Tools. Connect me on LinkedIn.
Upcoming SPSS Online Training Online classes
| Batch starts on 13th Feb 2026 |
|
||
| Batch starts on 17th Feb 2026 |
|
||
| Batch starts on 21st Feb 2026 |
|

