What is Kibana
Kibana is a browser-based open source visualisation application that is primarily used for analysing huge amounts of data in the form of bar graphs, line graphs, heat maps, coordinate maps, pie charts, region maps, goals, gauges and other visual representations. It is simple to foresee or detect changes in trends of errors or other major events of the input source with the help of these visualisations. Kibana connects with Elasticsearch and Logstash, which comprise the ELK stack.
What Is Kibana Used For?
Kibana is a platform for exploring and analysing massive amounts of semi-structured log data. Kibana offers a user interface for handling Elasticsearch authorization and authentication in addition to visualisation, data exploration and analysis. For the data stored in Elasticsearch as part of the ELK stack, Kibana acts as the web interface. Examples of use cases include Real-time website traffic analysis, monitoring and analysis of sensor data, e-commerce website sales statistics, monitor for email delivery.
ELK Stack
Elastic is the organization working on the Elastic Stack which includes Elasticsearch, Beats, Kibana, and Logstash. ELK is the abbreviation for three open source ventures: Elasticsearch, Kibana, and Logstash. Elasticsearch is an inquiry and analytics motor. Kibana allows clients to envision information with charts and diagrams in Elasticsearch. Logstash is a server‑side information preparing pipeline that extracts information from numerous sources all the while, changes it, and afterward transfers it to something called ‘stash’ like Elasticsearch. The Elastic Stack is the further advancement of the ELK Stack.
ELK Stack furnishes tight coordination to Elasticsearch, a famous investigation and web index, which settles on Kibana, the decision for visualizing information put away in Elasticsearch.
Functions of ELK Stacks
Logstash is a tool for gathering logging data or events from various sources. It handles Elasticsearch events and deposits. Kibana retrieves the data from the Elasticsearch and displays it in the form of a pie chart, line or a bar graph.
Take your career to next level in ELK Stack with hkr. Enroll now to get ELK Stack certification course training
Target Audience
This instructional exercise is intended for any specialized or non-specialized clients keen on breaking down enormous volumes of information for example, log examination, data investigation and so forth. Kibana is a program based UI and very easy to use and any amateur can without much of a stretch and in short simple for anyone to get a handle on it. The establishment for Kibana and Elasticsearch is direct and will be simple for the clients to complete it rapidly. To work with Kibana you have to have fundamental subtleties of Elasticsearch.
Kibana benefits in Amazon Elasticsearch Service
Kibana can be run on boundaries, particularly on Amazon EC2 (Amazon Elasticsearch Service). While availing game plans, we are liable for furnishing the establishment, presenting Kibana programming, and handling the pack. Through Amazon Service, Kibana is sent therefore with your space as a totally directed organization, normally managing all the difficult work to administer the pack. To make it straightforward for customers to run Elasticsearch and Kibana, AWS offers Amazon Elasticsearch Service, a totally regulated organization that passes on Elasticsearch with work in Kibana. To start, basically load the data into an Amazon Elasticsearch Service space and examine it using the Kibana end-point. It offers intuitive charts, easily accessible dashboards, planning support, pre assembled aggregations and filters.
Characteristics of Kibana
Following are the Characteristics of Kibana:
- Visualization: There are a number of simple ways to present data in Kibana. Examples of a few of the frequently used visualisations include heat maps, pie charts, line graphs, vertical bar charts, and horizontal bar charts, etc.
- Dashboard: When the visualisations are prepared, they can all be arranged on a single Dashboard. Observing various sections together provides the viewers a clear overall picture of what is going on.
- Dev Tools: Using dev tools, users can interact with the indexes. Dummy indexes can be added from dev tools by beginners, and they can also add, modify, and remove data and employ the indexes to generate visualisation.
- Reports: The entire data that is present in the dashboard in the visualisation formats can be exported as reports in CSV format, implemented in the code, or in the URLs in order to be forwarded to other people.
- Filters and Search query: To retrieve the necessary information from a dashboard or visualisation tool for a specific input, you might use filters and search queries. Data filtering and queries are performed using intuitive Kibana Query Language (KQL)
- Plugins: Third-party plugins can be added to Kibana to bring new visualisations or other UI improvements such as calendar visualisation, 3D graphs and Prometheus exporter.
- Coordinate and Region Maps: In Kibana, a coordinate and region map aids in displaying the visualisation on the geographical map while providing an accurate view of data.
- Timelion: Another visualisation tool that is generally used for the time-based data analysis is Timelion, sometimes known as a timeline. When working with a timeline, we must employ a simple expression language that enables us to connect to the index and do calculations on the data to provide the desired results. It is more helpful in Comparing data to the prior cycle in terms of week, month, etc.
- Canvas: Another powerful feature of Kibana is canvas. You can visualise your data using a canvas by using different shapes, colour combinations, texts, and numerous pages, also known as a workpad.

Kibana Training
- Master Your Craft
- Lifetime LMS & Faculty Access
- 24/7 online expert support
- Real-world & Project Based Learning
Types of visualisations:
With numerous possibilities for displaying and visualising data, Kibana's visualisation capability is its most important feature.
- Lens: With its drag-and-drop interface, Lens lets users swiftly move between different visualisation formats. For the majority of use scenarios, this interface is suggested.
- Pie chart: It displays the contribution of each source to the total.
- Goal and Gauge: It displays a number that represents the advancement.
- Maps: the editor for geographic data in Kibana called Maps lets you layer information on top of maps.
- Vega: Vega is employed to display the data according to the query.
- Data Table: Presents accumulation data in the form of a table.
Create a Dashboard
To create a dashboard, we need to first index the data into the ElasticSearch To get data from visualisations, maps, Elastic Search or saved searches. If these are missing, you are required to add them while creating the dashboard, or we can add them using a sample data set.
To create a dashboard, we must first open the dashboard tab and then choose the “create new Dashboard option. We must add elements like saved searches, visualisations, and maps to the panels after creating the dashboard.
Adding Visualisations to a dashboard
We must arrange the visualisations in the dashboard after it has been created.
The steps that must be taken to create the dashboard
- First Open the dashboard
- Choose Create New Dashboard from the Overview Page of the Dashboard.
- Set a time filter, such as June 13, 2020 to June 20, 2020, in this step.
- Choose “Add” in the Menu bar.
- Include markdown example, map example, and bar example.
Installing Kibana
Assuming Elasticsearch is already set up and running, we'll begin by installing Kibana. Look at our Elasticsearch guide to learn more about installing Elasticsearch.
There are several ways to install Kibana, depending entirely on the operating system and environment we use. We will install Kibana on an Ubuntu 16.04 computer running on AWS EC2 that already has Elasticsearch and Logstash installed.
Begin by downloading as well as installing the Elastic public signing key:
https://artifacts.elastic.co/GPG-KEY-elasticsearch | sudo apt-key
add -
Include the following repository definition:
echo "deb https://artifacts.elastic.co/packages/7.x/apt stable main" | sudo
tee -a /etc/apt/sources.list.d/elastic-7.x.list
It's important to keep in mind that there is a separate package with just features covered by the Apache 2.0 licence. Use the following code to install this package:
echo "deb https://artifacts.elastic.co/packages/oss-7.x/apt stable main" |
sudo tee -a /etc/apt/sources.list.d/elastic-7.x.list
The only thing left is to update the repositories and install Kibana:
sudo apt-get update
sudo apt-get install kibana
Make sure the following configurations are defined in the Kibana configuration file located at /etc/kibana/kibana.yml:
server.port: 5601
elasticsearch.url: "http://localhost:9200"
These particular configurations indicate Kibana which Elasticsearch instance to connect with and the port to utilise.
Start Kibana now by entering:
sudo service kibana start
Using the address http://yourServerIP>:5601,open Kibana in the browser. Then the Kibana home page will then be displayed to you.
Kibana Index Pattern
Elasticsearch and Kibana connect through index patterns. Kibana knows which data to obtain or use from Elasticsearch based on a defined index pattern. You can add an index pattern by using the following steps:
1.To find options in Kibana, use the search box at the top of the page. To start searching, use CTRL+/ or click the search box.
2. Then type the index patterns. Hit the enter button to choose the search result.
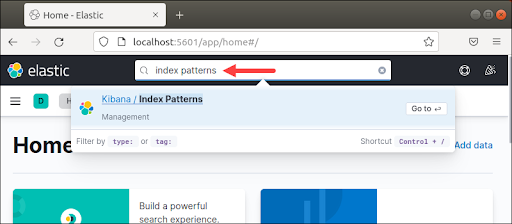
Search results are not case-sensitive.
3. A page titled Index Patterns appears. To create an index pattern, select Create index pattern.

4.To specify the index pattern, look for the desired index by typing the exact name in the search. To find numerous indexes with the same name or to find a near match, use an asterisk (*).
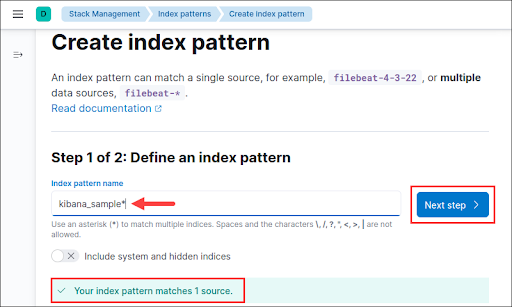
If you are unclear of the index name, a list of available index patterns is provided at the bottom. The tutorial makes use of the Kibana sample web traffic data. To proceed, select Next.
5. If there is a timestamp on the index of the data, choose the default time field to use when we filter the data by time. From the drop-down menu, choose the relevant choice.
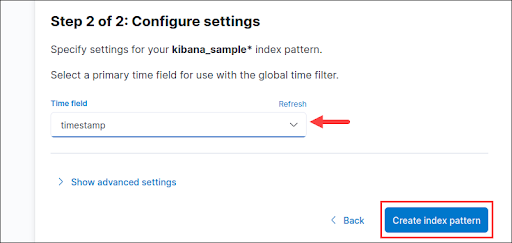
If you don't have time data or wish to merge time fields, choose “I don't want to use the time filter” as an alternative. To finish, click the Create index pattern button.
6. In the search bar(CTRL+/), enter Discover and click Enter to explore the data.
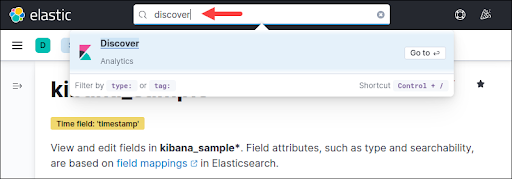
7. From the dropdown menu located at the left pane, choose the index pattern.
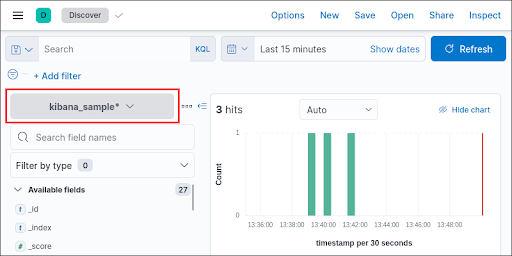
The data from the defined index pattern is displayed on the discover page.
Kibana Search
Kibana provides a number of ways to run data queries. The learning curve is sped up by the availability of autocomplete and suggestion options when you click the search field. Save the code for visualisation usage later.
The most popularly used method of searching the information is listed here along with some of the best practices.
1. KQL and Lucene
Versions 6.2 and the versions prior to it used Lucene for querying the data. To enhance searching, more recent versions now provide users the choice of using the Kuery or KQL languages. The option to switch back to Lucene is available in versions 7.0 and later, which by default use the KQL.
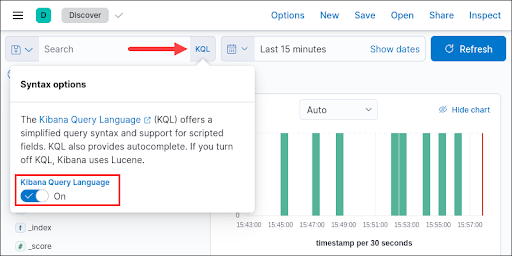
Click the KQL button with in search bar to switch to Lucene. turn Off setting for Kibana Query Language.
2. Text Search
To make a free text search across all of the accessible data fields, use the search box with no fields or local statements.
Try increasing the time field adjacent to the search box to cover a wider range if no data returns.
Single Word Query: The word elasticsearch can be searched for to locate all occurrences in the data across all fields.
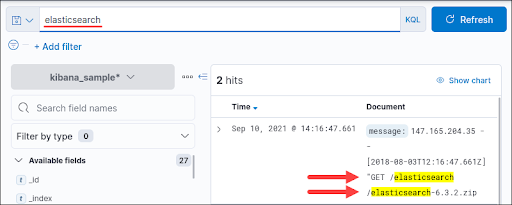
In Kibana, the query is not case-sensitive. If you want to search fuzzy strings, just use asterisk (*) symbol.
Multi Word Query: To separate words and search for numerous distinct terms, press the spacebar.
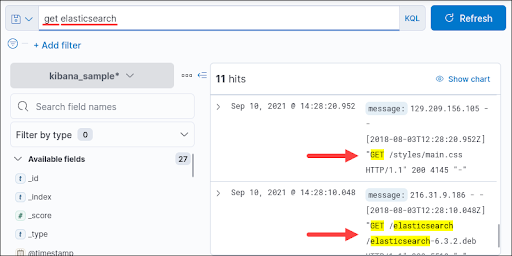
Example, get elasticsearch finds get and elasticsearch as distinct words.
String Query: Use quotation marks to match a string exactly.
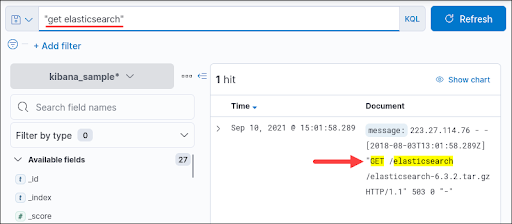
"get elasticsearch," for example, searches the entire string.
3. Field Search
Individual field searches are possible in Kibana. Look through all of the options listed under Available fields in the menu window on the bottom left.
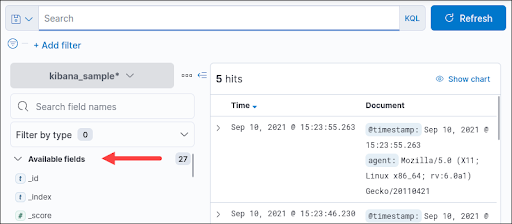
Use the below syntax to carry out the search in a particular field:
: Depending on the field type, the query syntax will vary.
Search Field for Exact Phrase
For the "404" message response, search the response.keyword field
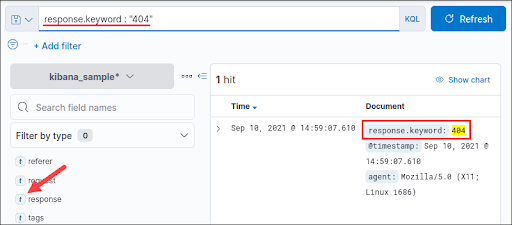
All instances that match the provided field are displayed in the output. Use a space to separate the query terms to check multiple values:
response.keyword : 404 200
The field type is set to t, which denotes that it is a text-type field.
Search Field Range
Date and Numeric types need a range frequently. Four range operators are supported by KQL.
- Less than (<).
- Greater than (>)
- Less than or equal to (<=)
- Greater than or equal to (>=).
For instance, look for the following date range:
@timestamp <= "2021-09-02"

The result displays all dates up to the specified date including it.
Kibana Filter
The Kibana filter aids in excluding or including fields in search queries.
1. Click the +Add filter link to create a filter.
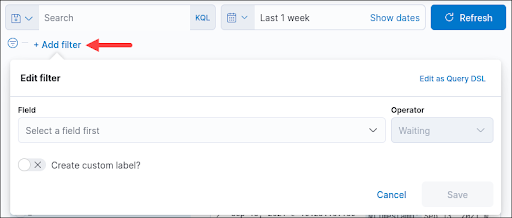
A dialogue box displays to create a filter.
2. To get autosuggestions, choose a Field from the dropdown menu or just start typing.
3. From the dropdown menu, select an Operator.
4. According to the operator selected, a new Value field appears. While all other operators require the Value field, the exists and does not exist choices do not. If the operator requires it, select the filtering value.
5. Optionally, make a special label for the filter. Choose the Create custom label checkbox and add the name. To finish, click Save.
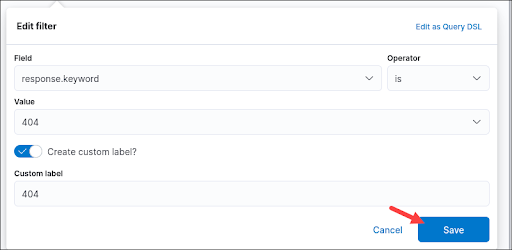
The filter is displayed below the search field and automatically applies to the current data and any future queries.

To make the dataset search even more specific, add additional filters.
Kibana Visualization
Kibana Aggregations
Elasticsearch aggregations serve as the foundation for Kibana visualisations. Simply said, Kibana provides the user interface (UI) for using these aggregations to specify the various dimensions seen in visualisations.
Metric aggregations and bucket aggregations are the two different sorts of aggregations. According to the logic and requirements, bucket aggregations group documents into a single bucket, whereas metric aggregations are used to determine a value for each bucket depending on the documents contained inside.
Different approaches are used by each form of visualisation to portray buckets and their values. Therefore, in a pie chart, for instance, the Metric aggregation determines the size of the slice while the Buckets aggregation determines the number of slices.
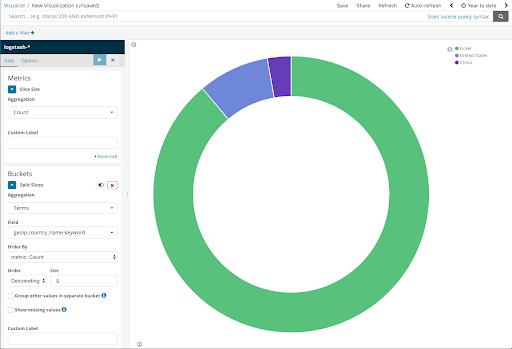
here are quite a few different Elasticsearch aggregation types that Kibana supports, each with unique configuration choices and field type restrictions.
Aggregations like the histogram and date histogram bucket, for instance, only function on integers. The Unique Count Metric aggregation can be used with any type of field, in contrast to the Min and Max Metric aggregations, which can only be used with number or the date fields.
Before moving forward, it is wise to perform some research on the various aggregate types and how they are used.
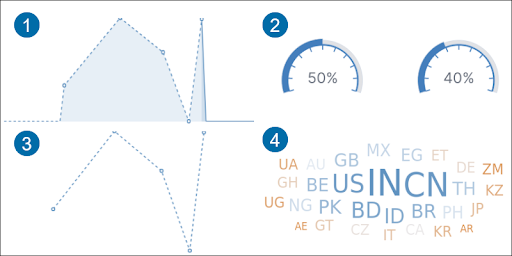
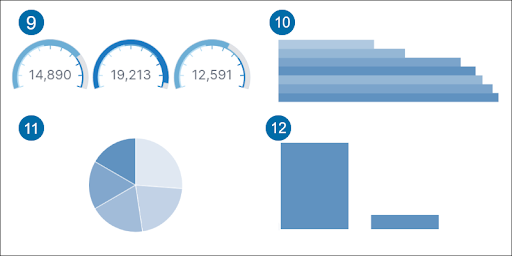
The Kibana aggregation tool offers a number of visualisations, including:
1. Data in between an axis and a line is highlighted by the area.
2. The metrics progress is tracked by the goal to a certain goal.
3. A line shows data as a collection of points.
4. A word frequency is shown by tag cloud.
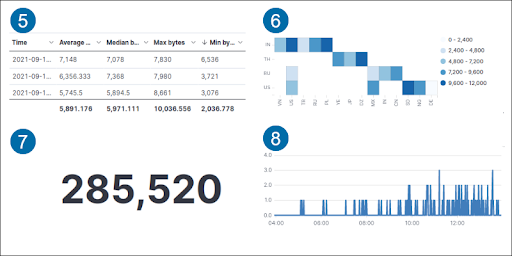
5. Data is displayed in rows and columns in a data table.
6. Data is shown in a cell matrix with shaded regions using a heat map.
7. Calculation outcome is displayed as a single number by Metric.
8. Time series data is graphed by Timelion.
9. Metric status is displayed by gauge.
10. On an axis, the horizontal bar shows data as horizontal bars.
11. Compared to whole, a pie chart compares data in portions.
12. On an axis, Data is shown as a vertical bar.
Create a Visualization in Kibana
Creating a visualization in Kibana:
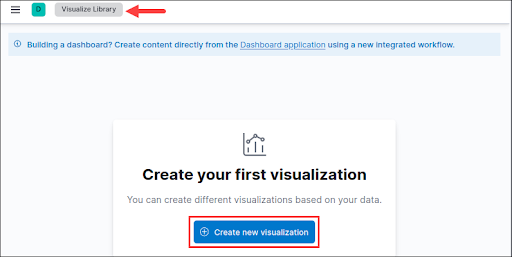
- In the search bar(CTRL+/) check for Visualise Library and Hit Enter.
- Select the button labelled “Create new Visualization).
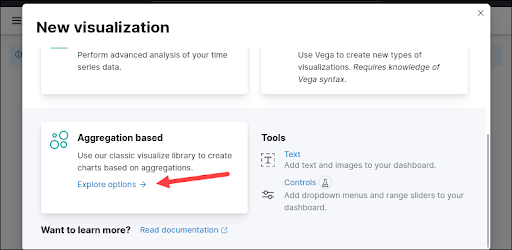
3) From the list, pick an option for visualisation type. For instance, select Aggregation based after scrolling down.
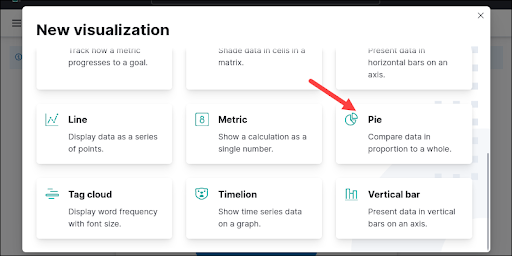
4) To make a pie chart, locate and choose Pie from the choices list.
5) Index pattern must be searched by name and then choose to continue. It displays a creation dashboard.
6) Choose Metrics for the data. By default, the count metric is chosen.
7) Bucket parameter is added and choose Split Slices.
8) Make your selections for the mandatory fields.

9) To view the pie chart, hit the Update button.
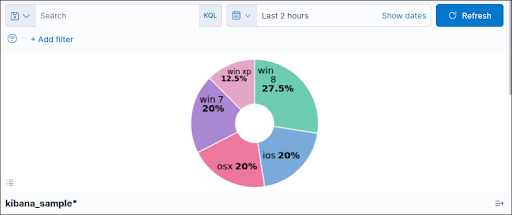
To change the visualisation, experiment with the options, filtering, and timeframe.
10) At the top right corner, Click the Save button when you are completed. To create a new dashboard, give the chart a name and choose New.
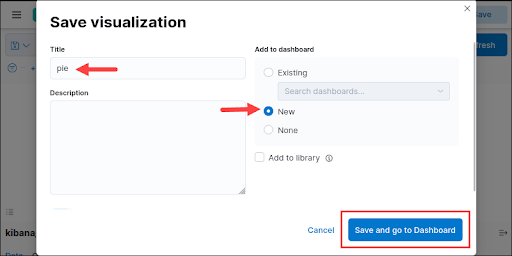
To view the visualisation in the dashboard, click Save and then navigate to the Dashboard. Enter a name for the dashboard before saving it.
Share Kibana Visualizations
Share the snapshot of current outcomes or the dashboard in real time. For sharing a Kibana dashboard,
1. Open the dashboard you want to share.
2. In the menu bar, select Share.

3) For generating an iFrame object, select the Embed Code option. To share it through a link instead, choose the Permalink option.
Want to get certified in kibana Learn from our experts and do excel in your career with hkr's kibana Online Course
Intuitive Charts
It assures instinctive graphs and details which can be used to intuitively explore through a lot of log information. We can change time windows, prepare down the notes, and zoom all through explicit information subgroups to separate noteworthy bits of knowledge from your information.
Easily Accessible Dashboards
Without much of a stretch we can set up dashboards, reports and offer them with others. All you require is a program to see and investigate the information.
Planning Support
It accompanies incredible geospatial capacities that aids to consistently layer in topographical data abreast the information and see outcomes on maps.
Pre-assembled Aggregations And Filters
We can run an assortment of data like histograms, patterns, and top N questions with only a couple of clicks.
Characteristics of Kibana
Visualization
Kibana has a great deal of approaches to envision data in a simple manner. A portion of the ones which are generally utilized includes vertical bar chart, pie chart, horizontal bar diagram, line chart, heat map.
Reports
All the information stored as visualization and dashboard can be changed over to reports in CSV format, installed into the code or as URLs to be imparted to other people.
Dashboard
At the point when we have the visualizations prepared, every one of them can be set on one board called the Dashboard. Watching various segments together gives us a reasonable opinion in general regarding what precisely is occurring. The two ways to start Kibana are either by using Flights dashboard and also by building your own dashboard.
Dev Tools
Working with the files utilizing dev devices. Tenderfoots can add sham files from dev apparatuses and furthermore add, erase the information, update, and utilize the files to make visualization.
Filters and Search query
We can utilize filters and quest inquiries to get the necessary subtleties for a specific contribution from a dashboard or visualization apparatus.
Plugins
We can add third party modules to add new visualization or likewise other UI options in Kibana.

Subscribe to our YouTube channel to get new updates..!
Coordinate and Region Maps
A coordinate and area map in Kibana assists with demonstrating the visualization on the geological guide giving a practical perspective on the information.
Timelion
Timelion, also known as timeline is one more visualization apparatus which is primarily utilized for time based information analysis. Inorder to work with this, one must utilize simple articulation language which encourages us interface with the list and to perform computations on the information to get the outcomes we required. It aids more in contrasting information to the past cycle as far as week , month and so forth.
Canvas
A remarkable component in Kibana. Canvas visualization helps in portraying your information in various shading mixes, colours, shapes, messages, different pages fundamentally known as workpad.
Advantages of Kibana
Kibana offers these benefits to its clients:
- It encloses an open source program based visualization device basically used to investigate huge volumes of logs as line graphs, pie charts, and heat maps.
- Basic and simple for tenderfoots to comprehend.
- Flexibility in changing visualization and converting dashboard into reports.
- The canvas visualization aids to investigate complex information in a simple manner.
- Timeline visualization assists with contrasting data in reverse inorder to comprehend the performance accurately.
Disadvantages of Kibana
- Adding plugins can be dull if there is form jumble.
- You will in general face troubles when you need to redesign from a much older version to a new updated one.
- Explore Kibana Sample Resumes Download & Edit, Get Noticed by Top Employers!
Kibana Vs Grafana
Kibana and Grafana are two mainstream open source tools that assist clients in visualizing and comprehending patterns inside huge measures of log data. Kibana makes use of data querying, analysis methods and visualization tools which permit clients to picture data in a wide range of ways, using charts, graphs, geographical maps and different kinds of representations. Grafana, an open source visualization apparatus which can be utilized on top of a wide range of information stores yet is mostly utilized along with Graphite, Prometheus, InfluxDB, Logz.io and Elasticsearch. This is a component rich trade for Graphite-web, which causes clients to effortlessly make and alter dashboards. It started as a stand for Kibana, attempting to gracefully uphold metrics that Kibana didn't give a lot of help for.
conclusion
An organization always struggles to collect, generate, process and store data. When it comes to analyzing the same data, it can be visualized so as to create a vivid picture of logs and metrics. Visualizing data assists groups with checking their current circumstance, recognize repetitive patterns and make a move while detecting bizarre conduct. Kibana furnishes clients with a device for investigating, visualizing, and fabricating dashboards on top of the log information put away in Elasticsearch groups.
Related Course:
About Author
As a senior Technical Content Writer for HKR Trainings, Gayathri has a good comprehension of the present technical innovations, which incorporates perspectives like Business Intelligence and Analytics. She conveys advanced technical ideas precisely and vividly, as conceivable to the target group, guaranteeing that the content is available to clients. She writes qualitative content in the field of Data Warehousing & ETL, Big Data Analytics, and ERP Tools. Connect me on LinkedIn.
Upcoming Kibana Training Online classes
| Batch starts on 26th Feb 2026 |
|
||
| Batch starts on 2nd Mar 2026 |
|
||
| Batch starts on 6th Mar 2026 |
|

